ROCKET BALLOON WITH WIRELESS ACCELEROMETER
Published: Sep-2024 | Category: Fun With Science
Turn a classroom favourite into a real physics investigation. A balloon rocket whizzing along a line always raises a smile. Add a Data Harvest Wireless 3‑Axis Accelerometer and that fun becomes a rich, curriculum‑ready experiment: students see the launch and measure the physics.
Sensor: Wireless Accelerometer 3‑axis
Learning objectives
- Relate thrust, drag and mass to measured acceleration (Newton’s 2nd law).
- Interpret acceleration–time data: thrust phase, coast/slowdown, and stop.
- Compare runs to explain how balloon size, line angle, line friction and added mass change the motion.
- Work with vectors by reading x/y/z axes or by deriving the resultant acceleration.
Apparatus
- Data Harvest Wireless 3‑Axis Accelerometer (with EasySense software).
- One long, smooth line: fishing line or taut nylon string.
- Two retort stands (or wall anchors) with bosses and clamps to tension the line.
- Short piece of straw (the line threads through the straw).
- Balloons (identical type if comparing fill levels).
- Adhesive tape (to mount the sensor to the balloon or straw carriage).
- Ruler or measuring tape (line length, balloon circumference).
- Protractor or digital angle gauge (for inclined runs).
- Small scales (optional, to estimate total mass).
- Eye protection; latex‑free balloons if required.
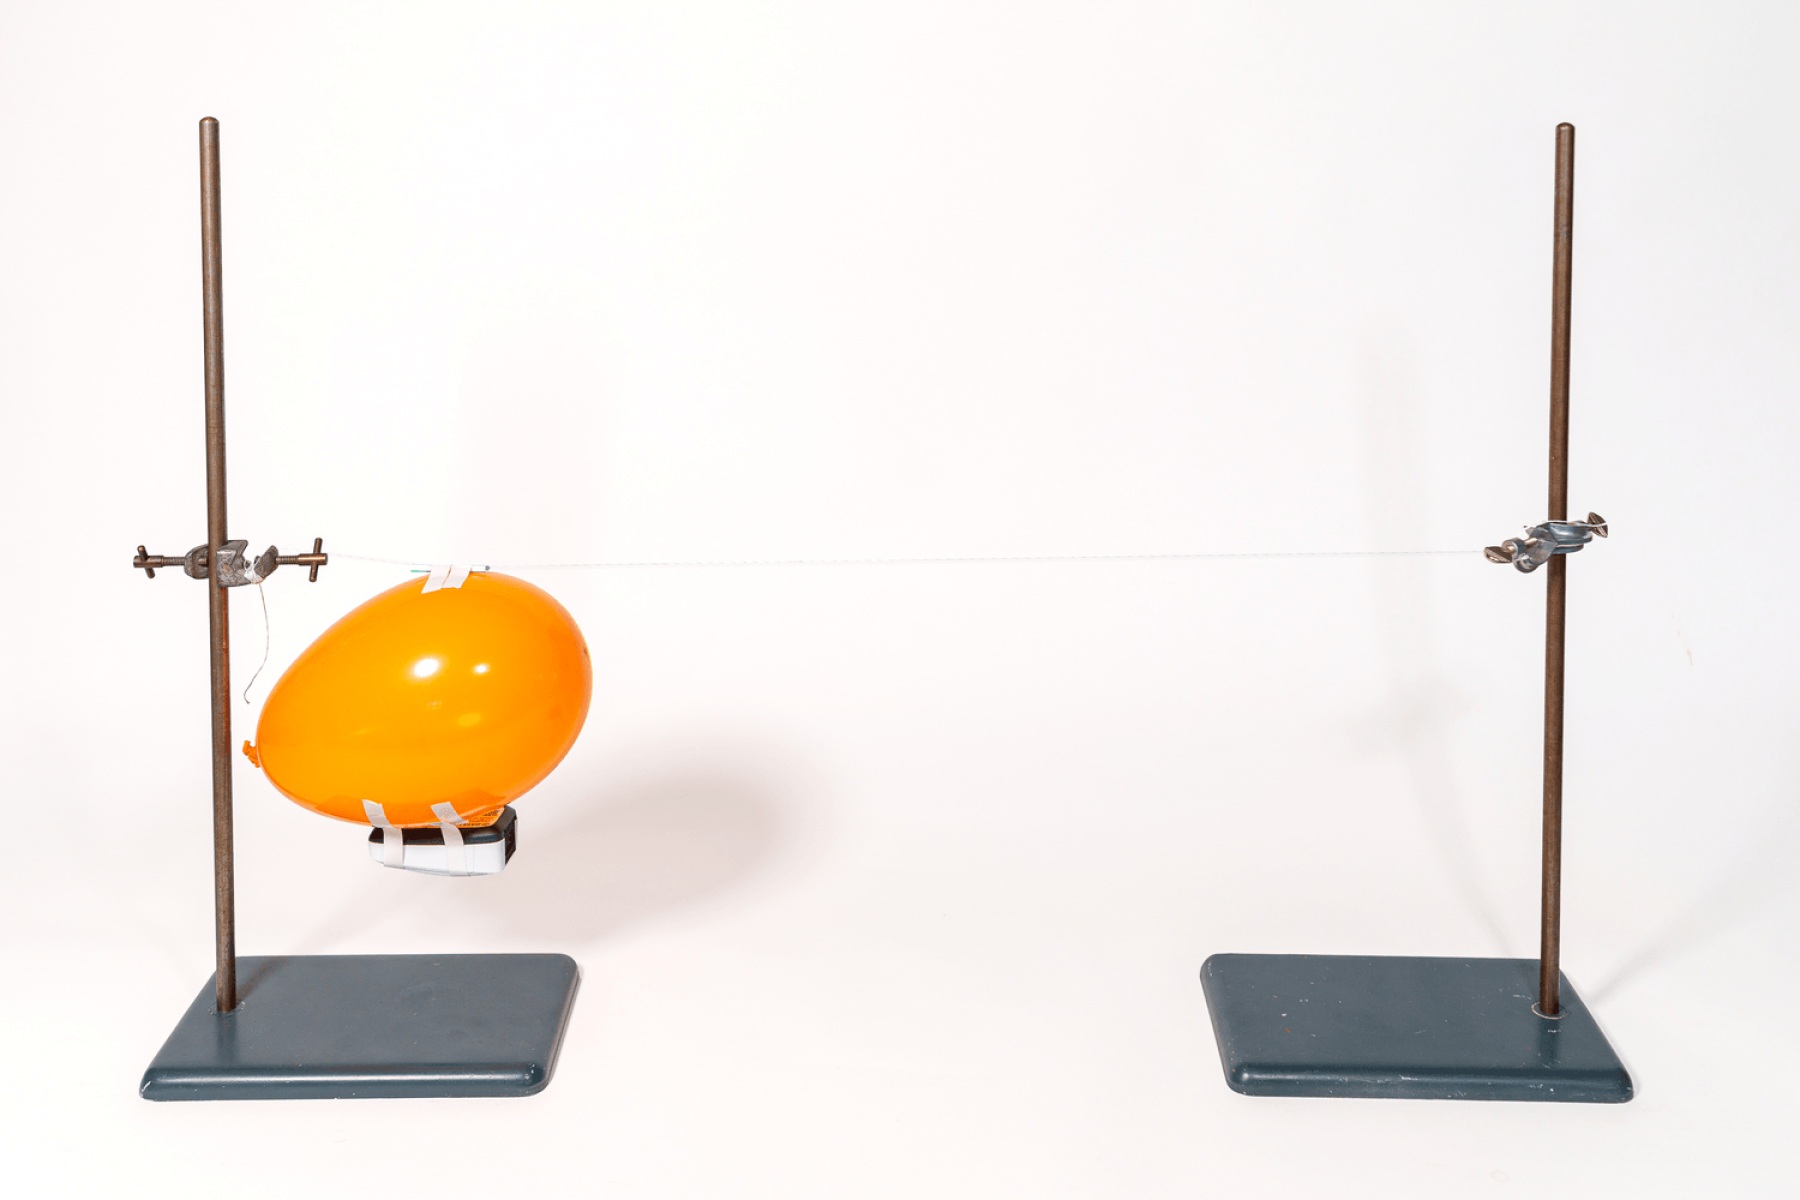
Setup (5–10 minutes)
- Rig the line between stands, roughly chest height. Pull it tight. For extension work, set a small angle (for example, +5° or -10°) using a protractor.
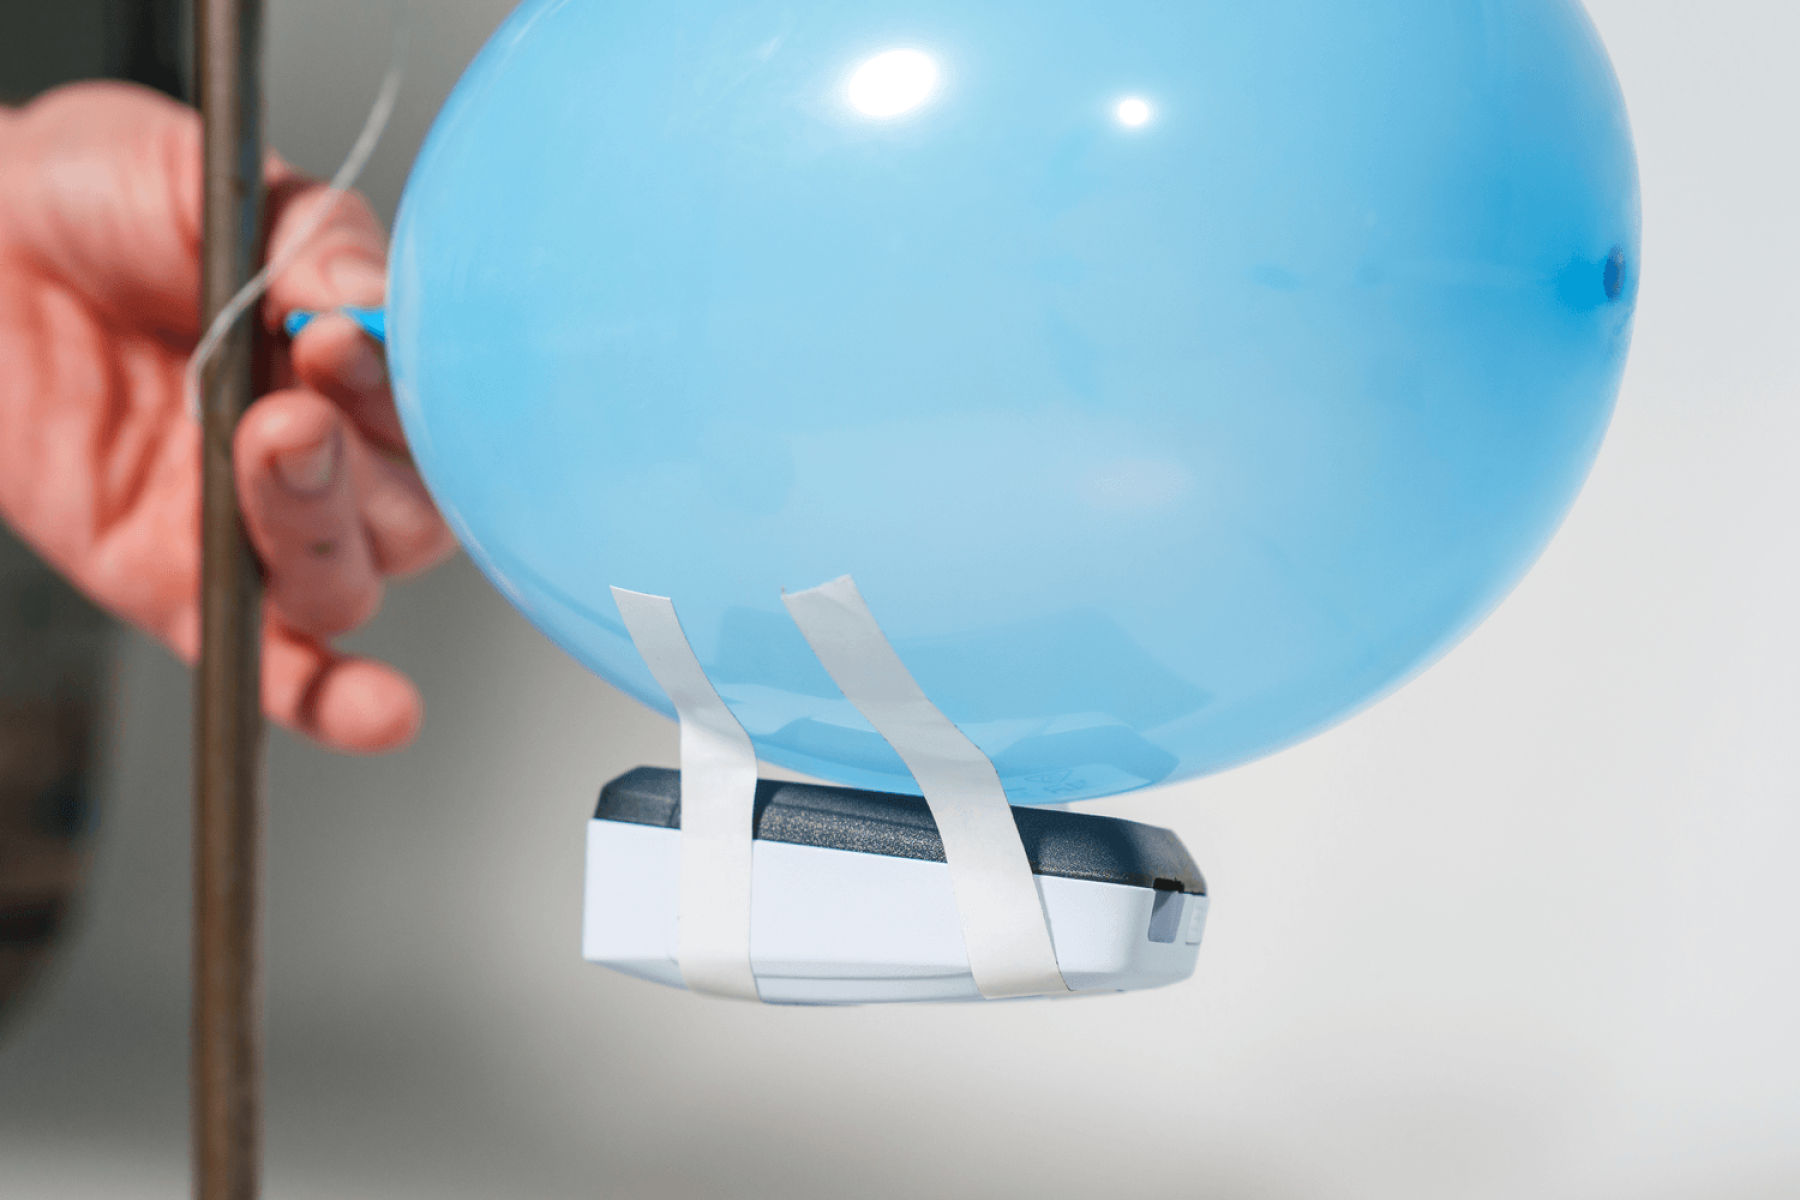
- Thread the straw onto the line. Tape the balloon to the straw (standard method) or tape the sensor and balloon to a lightweight paper carriage taped to the straw.
- Mount the sensor so that one axis points along the line (the “along‑track” axis). Keep the tape light and symmetrical.
- Connect and zero: pair the sensor, place it still for a moment and zero/offset within EasySense.
- Sampling settings: start with about 100 Hz. Set a total capture time of 5–10 seconds.
Teacher tip: If you’re unsure about the best range/sensitivity, begin at a mid‑range, do one test run, and adjust to avoid clipping the peak.
Method
- Mark balloon fill levels (for example, Small, Medium, Full). Use a strip of paper to measure circumference for consistency.
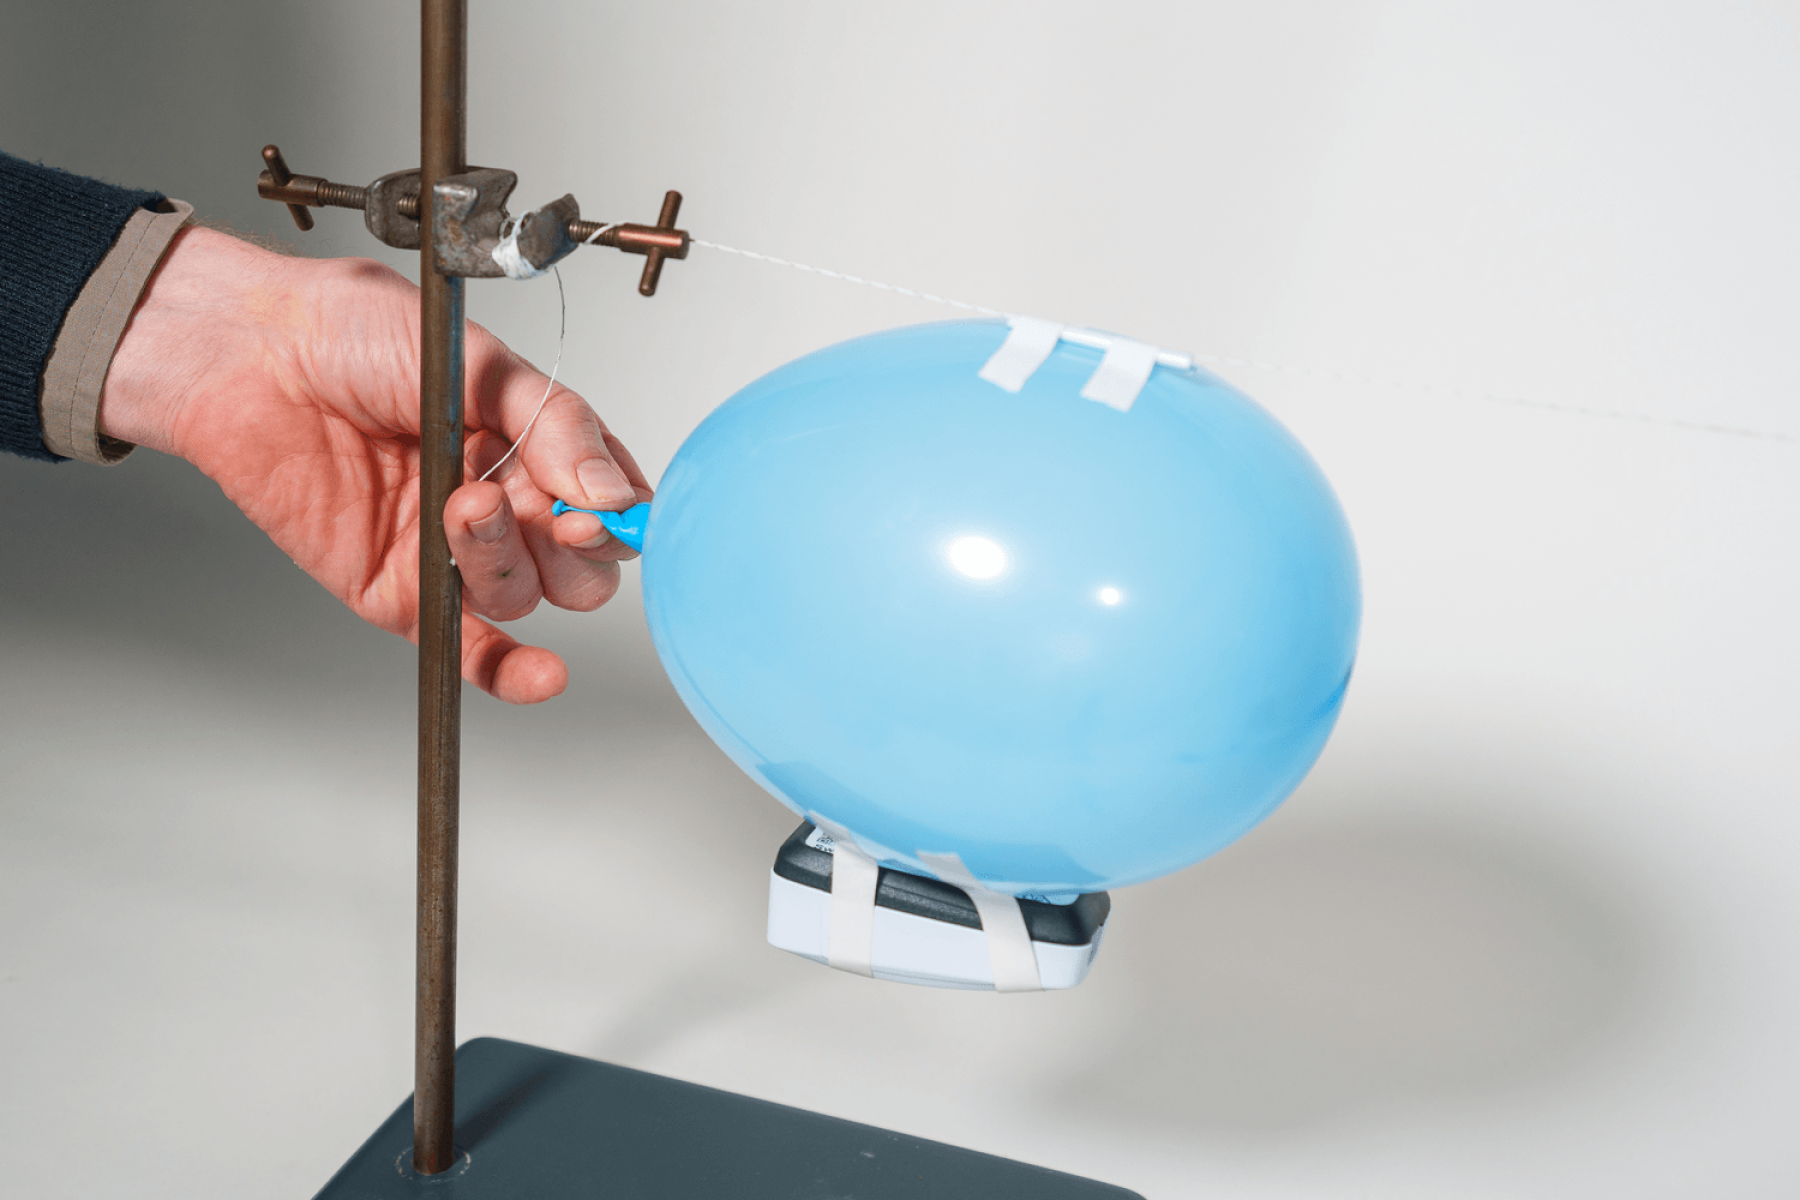
- Inflate and hold the balloon nozzle shut. Keep the straw centred on the line.
- Arm the recording in EasySense and release. Do not push.
- Repeat at least three runs per condition for reliable comparisons.
- Change one variable at a time (fill level, then line angle, then added mass, then line type, and so on).
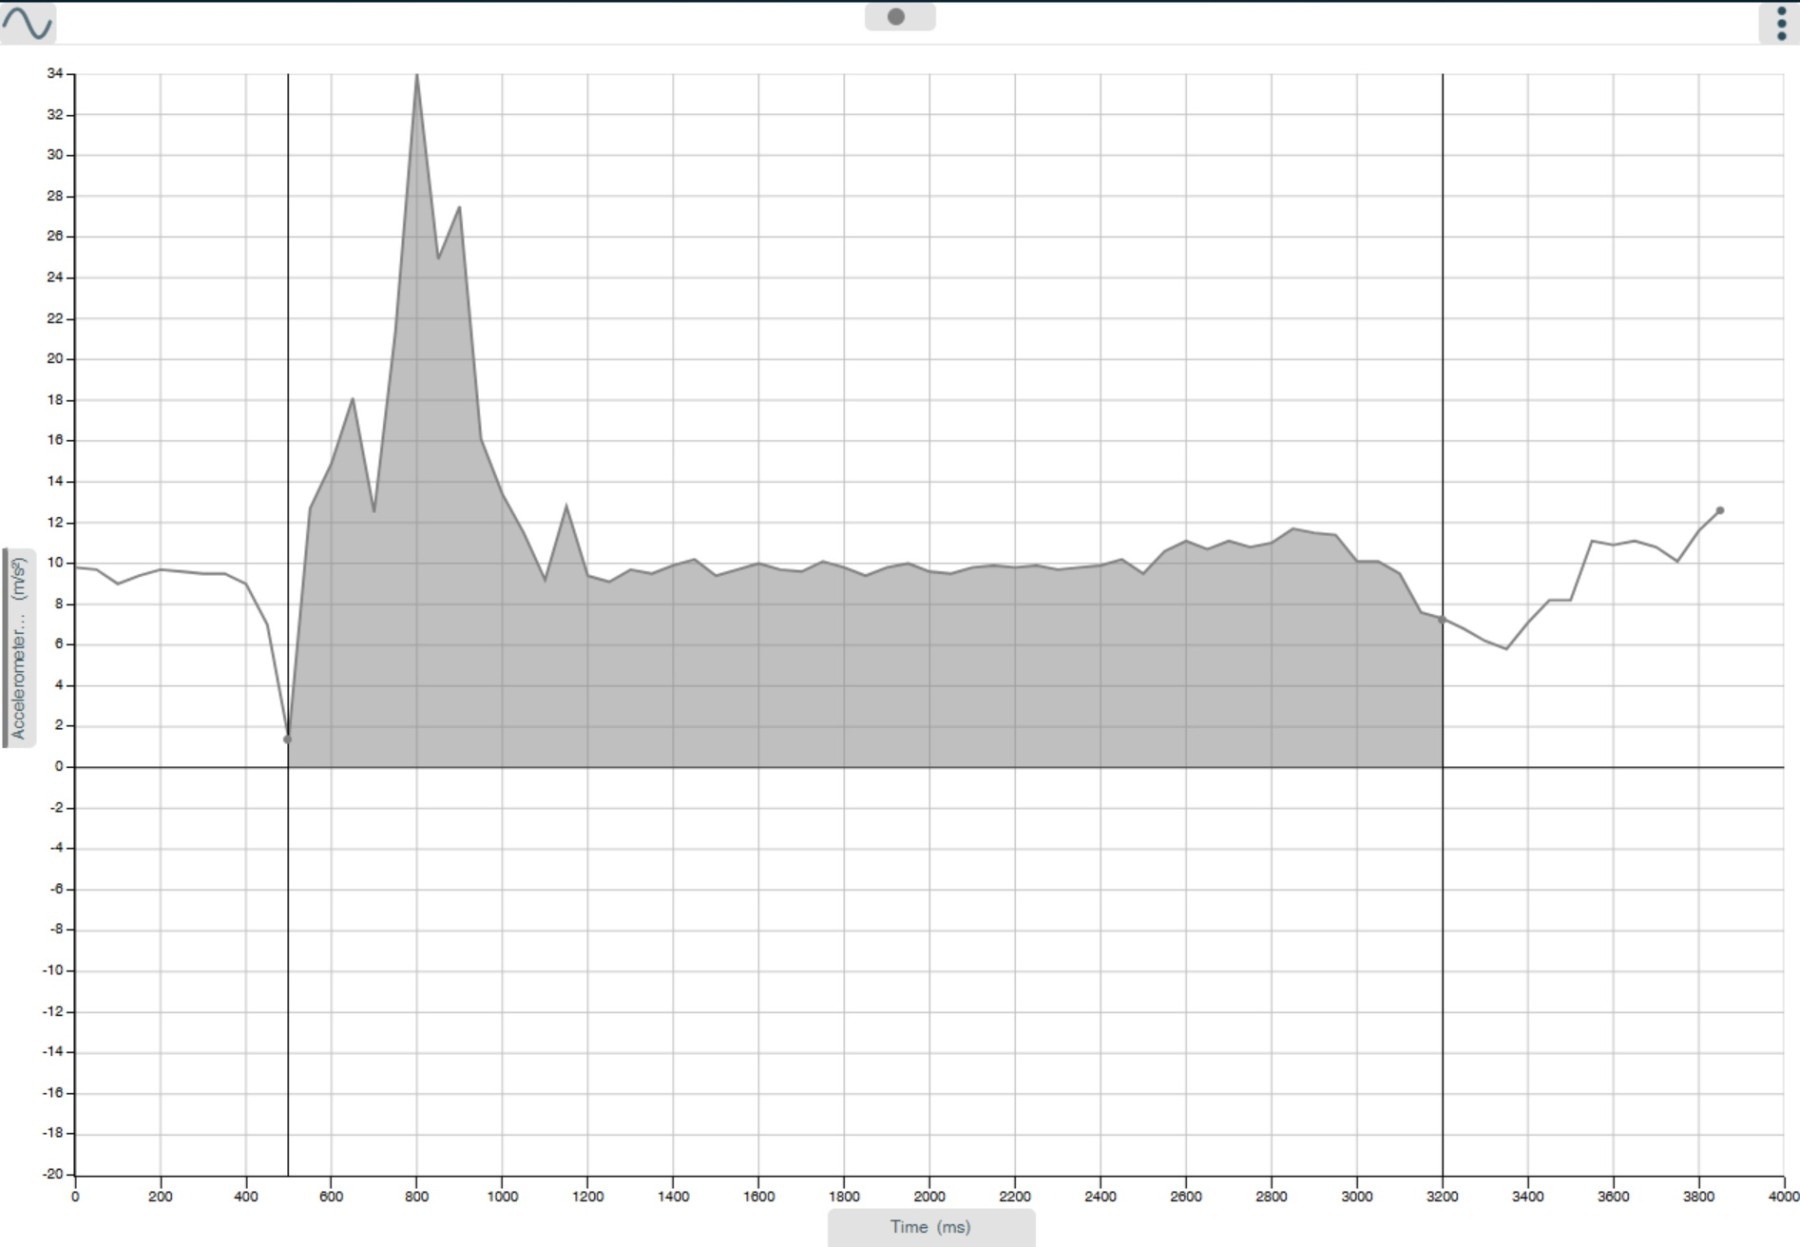
What the data shows
- Thrust phase: a sharp positive acceleration spike along the line as air rushes out.
- Wobble and twist: small, rapid oscillations on the lateral axes (y and z) as the balloon yaws or pitches; the along‑track axis may show ripples too.
- Thrust ends: acceleration crosses through zero, then becomes negative as drag (and any line friction or downslope weight component) slows the rocket.
- Stop: brief spikes as the balloon shudders to a halt.
For cleaner comparison across runs, calculate resultant acceleration:
a_resultant = sqrt(ax^2 + ay^2 + az^2)
Data analysis
- Annotate phases on the acceleration–time graph: thrust, coast/slowdown, stop: label in EasySense.
- Record the peak acceleration during thrust for each balloon size.
- Compare conditions: make a bar chart of peak acceleration versus balloon size; and a line chart of peak acceleration versus line angle.
- Optional smoothing: apply a light smoothing in EasySense.
- Extension: integrate the along‑track acceleration to estimate velocity–time (expect some drift).
- Forces: discuss Fnet = m a. On an incline, include mg sinθ
Explain the science
- Newton’s 3rd law (action–reaction): air rushing out pushes backwards; the balloon is pushed forwards with equal and opposite force (thrust).
- Newton’s 2nd law: net force along the line causes acceleration (F = m a). Bigger thrust or smaller mass gives bigger acceleration.
- Drag: air resistance grows with speed and opposes motion.
- After thrust ends, drag (and friction, or mg sinθ on an incline) dominate, so acceleration becomes negative until the rocket stops.
Extensions and adjustments
A - Balloon fill level (thrust and impulse)
- Runs at Small, Medium and Full. Predict: fuller gives larger thrust spike and longer thrust duration.
- Plot peak acceleration and time above a threshold (for example, a > 0.5 m s⁻²) versus fill level.
B - Angle of the line (components of weight)
- Test 0°, 5° and 10° upslope and downslope.
- Predict: upslope adds mg sinθ opposing motion, reducing peak acceleration; downslope does the opposite after thrust ends.
C - Line and carriage friction (fair tests)
- Compare cotton string with fishing line; bare straw with PTFE‑lined straw.
- Expect smoother lines to give higher peak acceleration and longer runs.
D - Jet size (nozzle restriction)
- Narrow the nozzle slightly.
- Explore short, strong thrust (wide jet) versus long, weaker thrust (narrow jet).
E - Stability and fins
- Add a light card fin or use a guided cradle to reduce yaw.
- Compare lateral axis noise before and after.
F - Resultant versus along‑track
- Decide whether resultant acceleration or along‑track acceleration is the better single metric.
Suggested questions
- Where on the graph can you prove that thrust is present? Where does it end?
- Why does a fuller balloon change both the peak and the duration of acceleration?
- On a 5° incline, what extra term appears in the force equation along the track?
- Why might two runs with the same balloon size give different peaks?
- Which is the most reliable single number to compare runs: peak acceleration, time‑to‑zero, or area under the positive part of the acceleration curve?
Troubleshooting
- Flat, noisy traces: increase sample rate or check axis alignment.
- Clipped peaks: reduce sensor sensitivity or pick a higher g‑range.
- Wild lateral spikes: reduce wobble (better alignment, lighter tape, a stabilising cradle).
- Short runs: tighten the line; switch to fishing line; smooth straw edges.
Safety notes
- Wear eye protection with taut lines and popping balloons.
- Consider latex allergies; provide latex‑free alternatives.
- Do not over‑inflate; clear the run‑out area; keep the line above eye level.
Curriculum links
- Forces and motion: Newton’s laws, F = m a, components of weight.
- Graphs and data: acceleration–time, smoothing, averages, uncertainties.
- Vectors: axes, resultants, components, interpretation.
- Enquiry skills: variables, fair tests, repeatability, reliability, evaluation.
Simple results table (template)
Condition
| Peak along‑track a (m s⁻²)
| Time of thrust (s)
| Notes on wobble
|
Small balloon
|
|
|
|
Medium balloon
|
|
|
|
Full balloon
|
|
|
|
5° upslope
|
|
|
|
+ paperclip mass
|
|
|
|
Teacher wrap‑up
Students already love the rocket balloon. With the Data Harvest Wireless 3‑Axis Accelerometer, they can prove what is happening: thrust causes a big positive acceleration, then, once the air is gone drag and friction bring the rocket to rest. By changing one variable at a time (fill level, angle, mass, friction) and comparing the measured effect, they build a durable understanding of force, motion and fair testing.