Published: Mar-2026 | Category: Fun With Science
What makes people dance more at a disco? Is it louder music, flashing lights, or a warmer room?
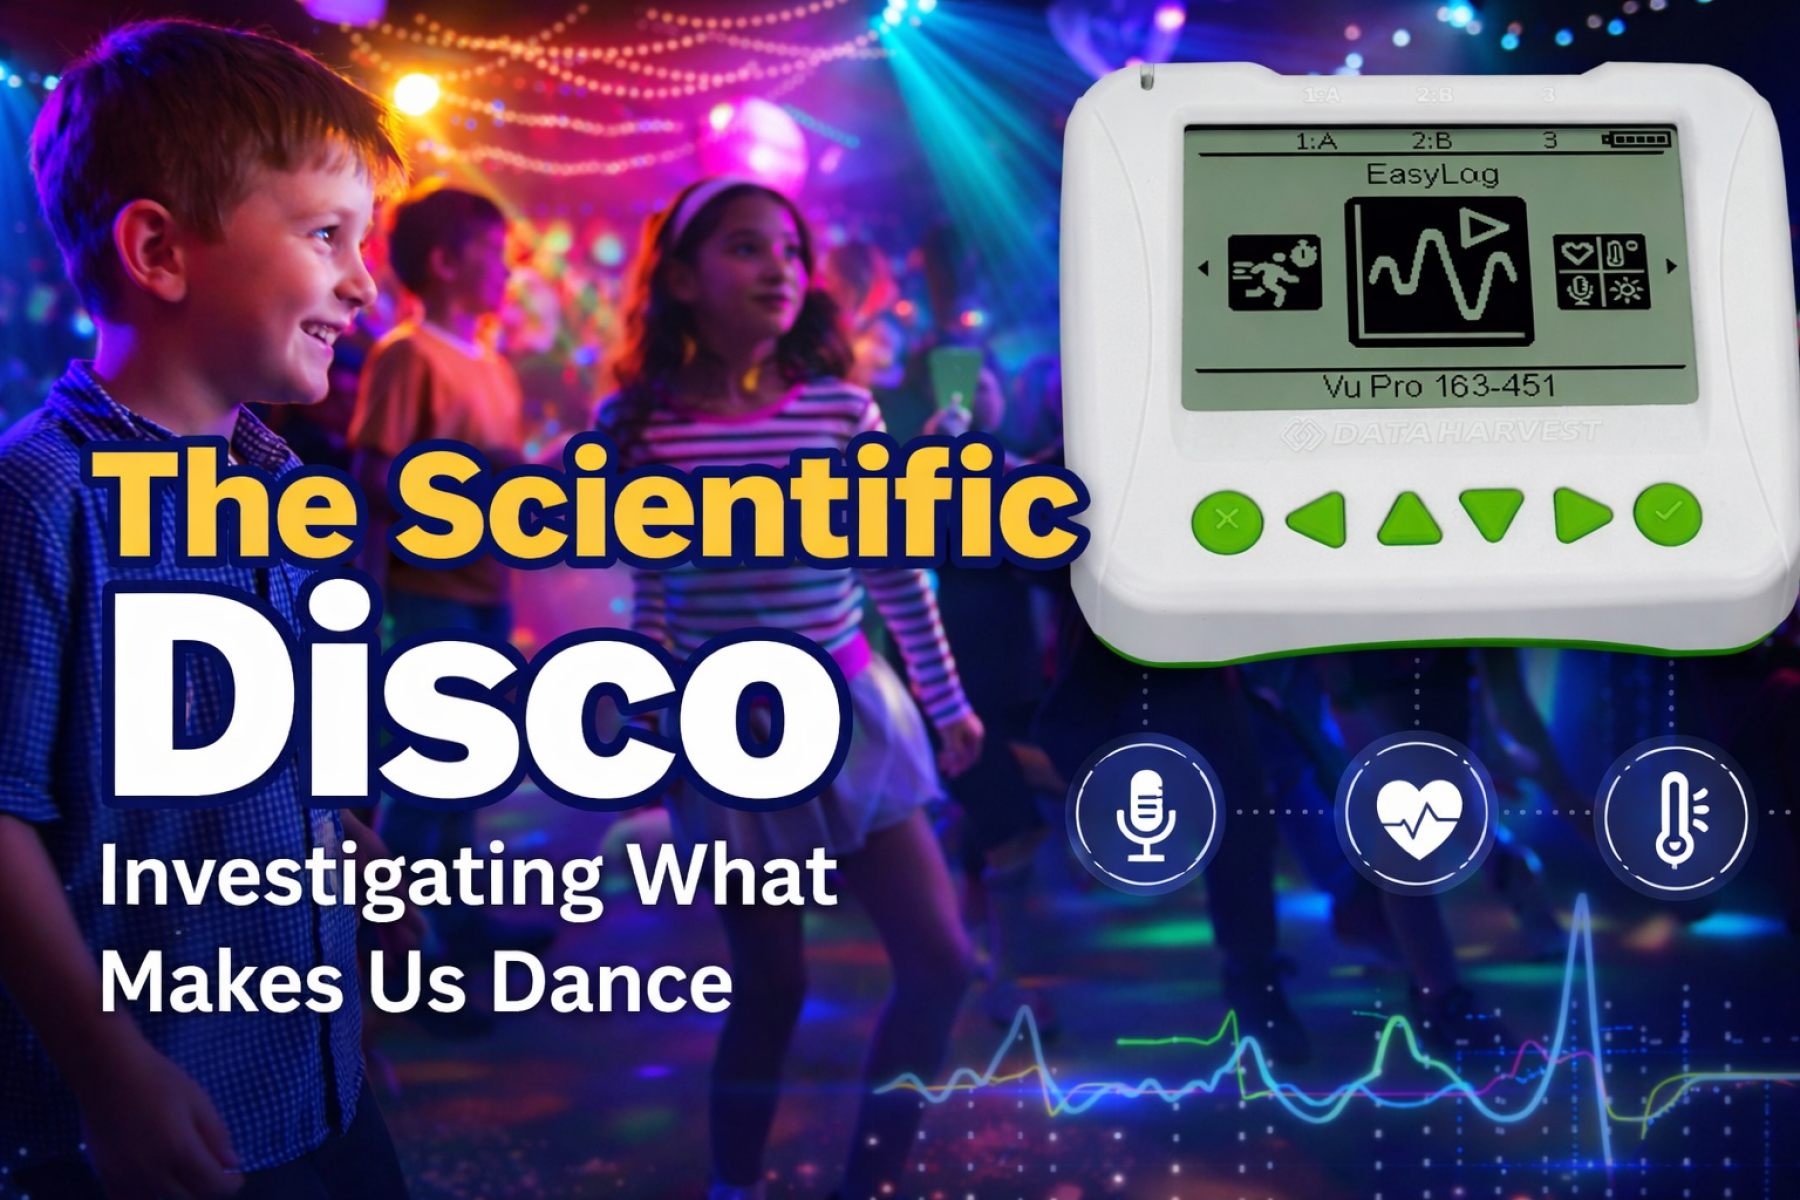
In this fun classroom investigation, students explore this question by turning the classroom into a Scientific Disco and using data logging equipment to measure how environmental factors influence activity levels.
By collecting real-time data on sound, light, temperature and heart rate, students can analyse the science behind movement and energy in an engaging and memorable way.
The investigation starts with a simple but exciting scientific question:
What makes us more active at a disco?
Students measure several factors that may influence activity levels:
These measurements can be captured using the range of Data Harvest Vu Sensors, which connect directly to the Vu Pro data logger.
To run this activity you will need:
The sensors used in this investigation are part of the Vu Sensor range, designed for quick connection and accurate classroom data collection.
Before collecting any data, students make predictions about what will cause the most activity.
Possible ideas include:
Encouraging students to explain their reasoning helps develop scientific thinking and hypothesis building.
To explore how music affects movement, students test several types of songs.
| Music Type | Description | Expected Activity |
|---|---|---|
| Slow music | Calm or relaxed songs | Low activity |
| Medium tempo | Typical pop songs | Medium activity |
| Fast dance music | Energetic dance tracks | High activity |
During each song, the sensors collect data while students dance.
The data logger continuously records:
Using the Vu Sensors, these measurements can be captured in real time and analysed later using EasySense software.
While the disco is happening, students also make observational notes.
Combining observations with sensor data helps students understand how science connects to real-world behaviour.
After the activity, the data can be transferred into EasySense software where students can view the results as graphs and tables.
Students investigate questions such as:
This step develops key scientific skills such as data interpretation and pattern recognition.
The Scientific Disco activity helps students develop important scientific skills:
Most importantly, it shows students that science can be explored in fun and unexpected ways.
If you would like to run this activity in your classroom, explore the full range of sensors available for the Vu data logger.
Take a look at the following articles from the same topic.