Data Harvest Company Logo
0

MEASURE WAVE SPEED WITH A SLINKY | A HANDS-ON LONGITUDINAL WAVES EXPERIMENT

Published: Mar-2026 | Category: Fun With Science

Explore longitudinal waves using real-time data logging

Waves are all around us — from sound travelling through the air to vibrations moving through solids. But how do we actually measure how fast a wave travels?

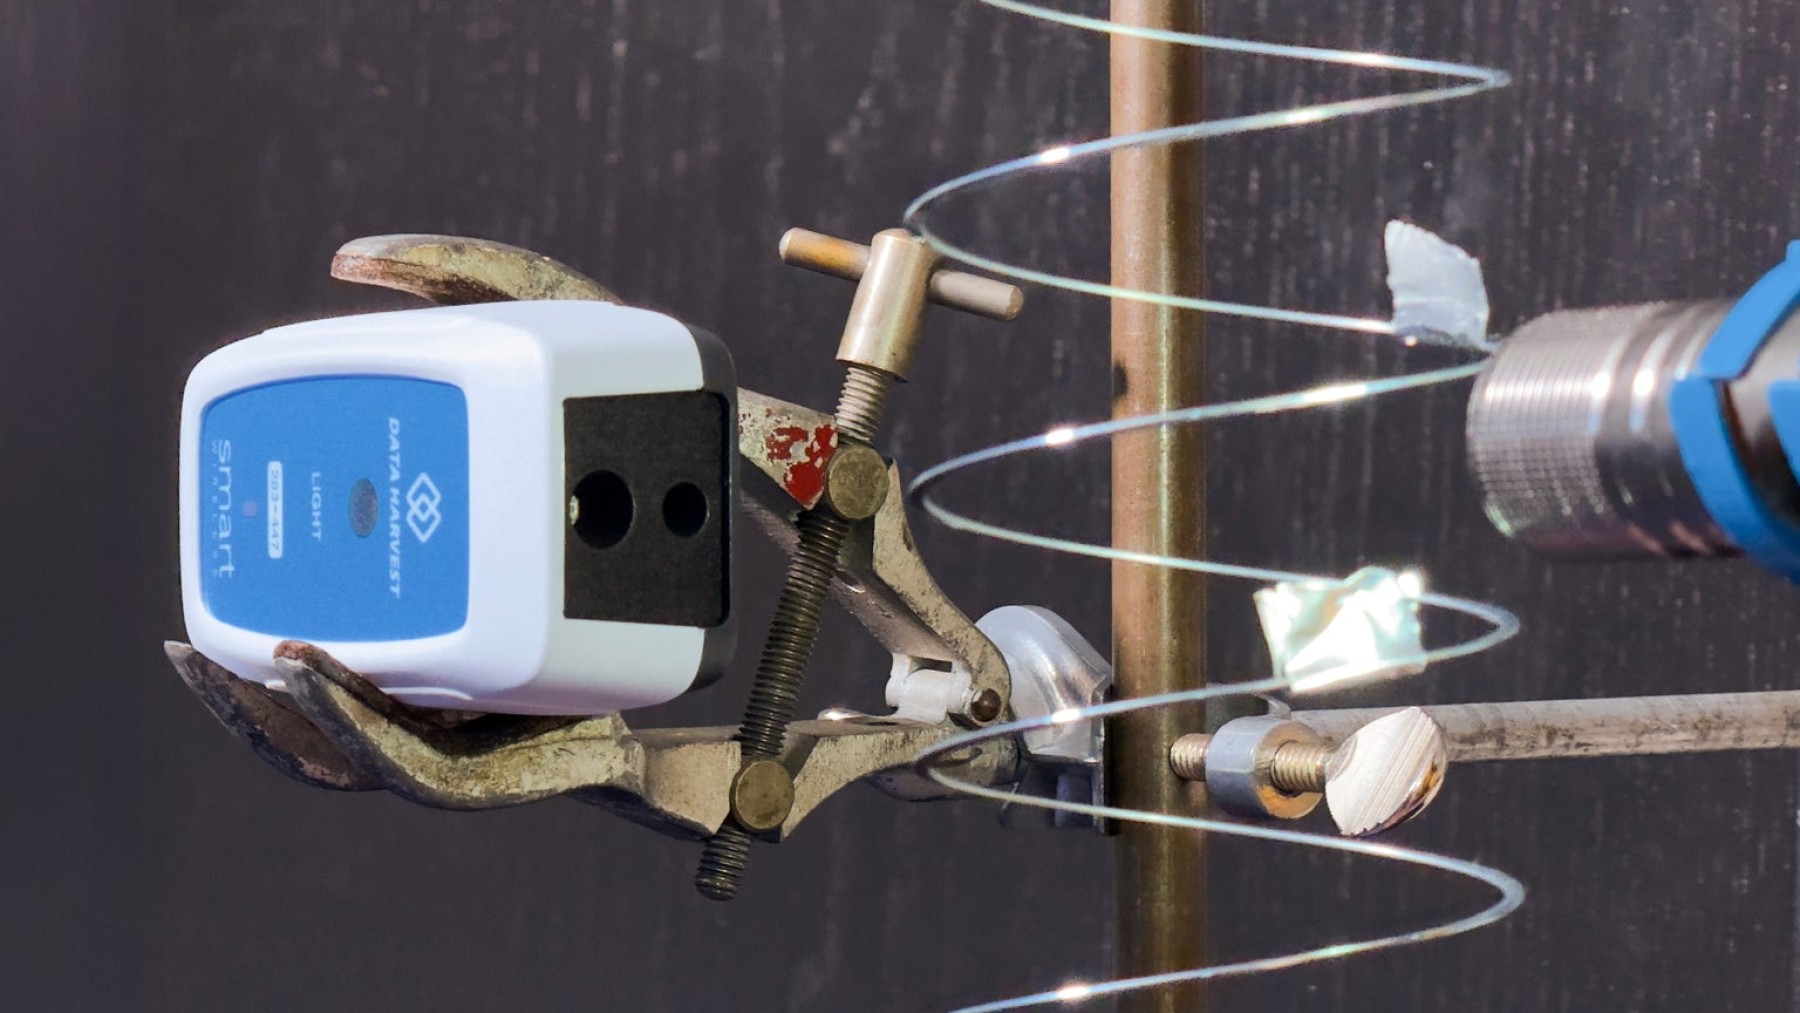
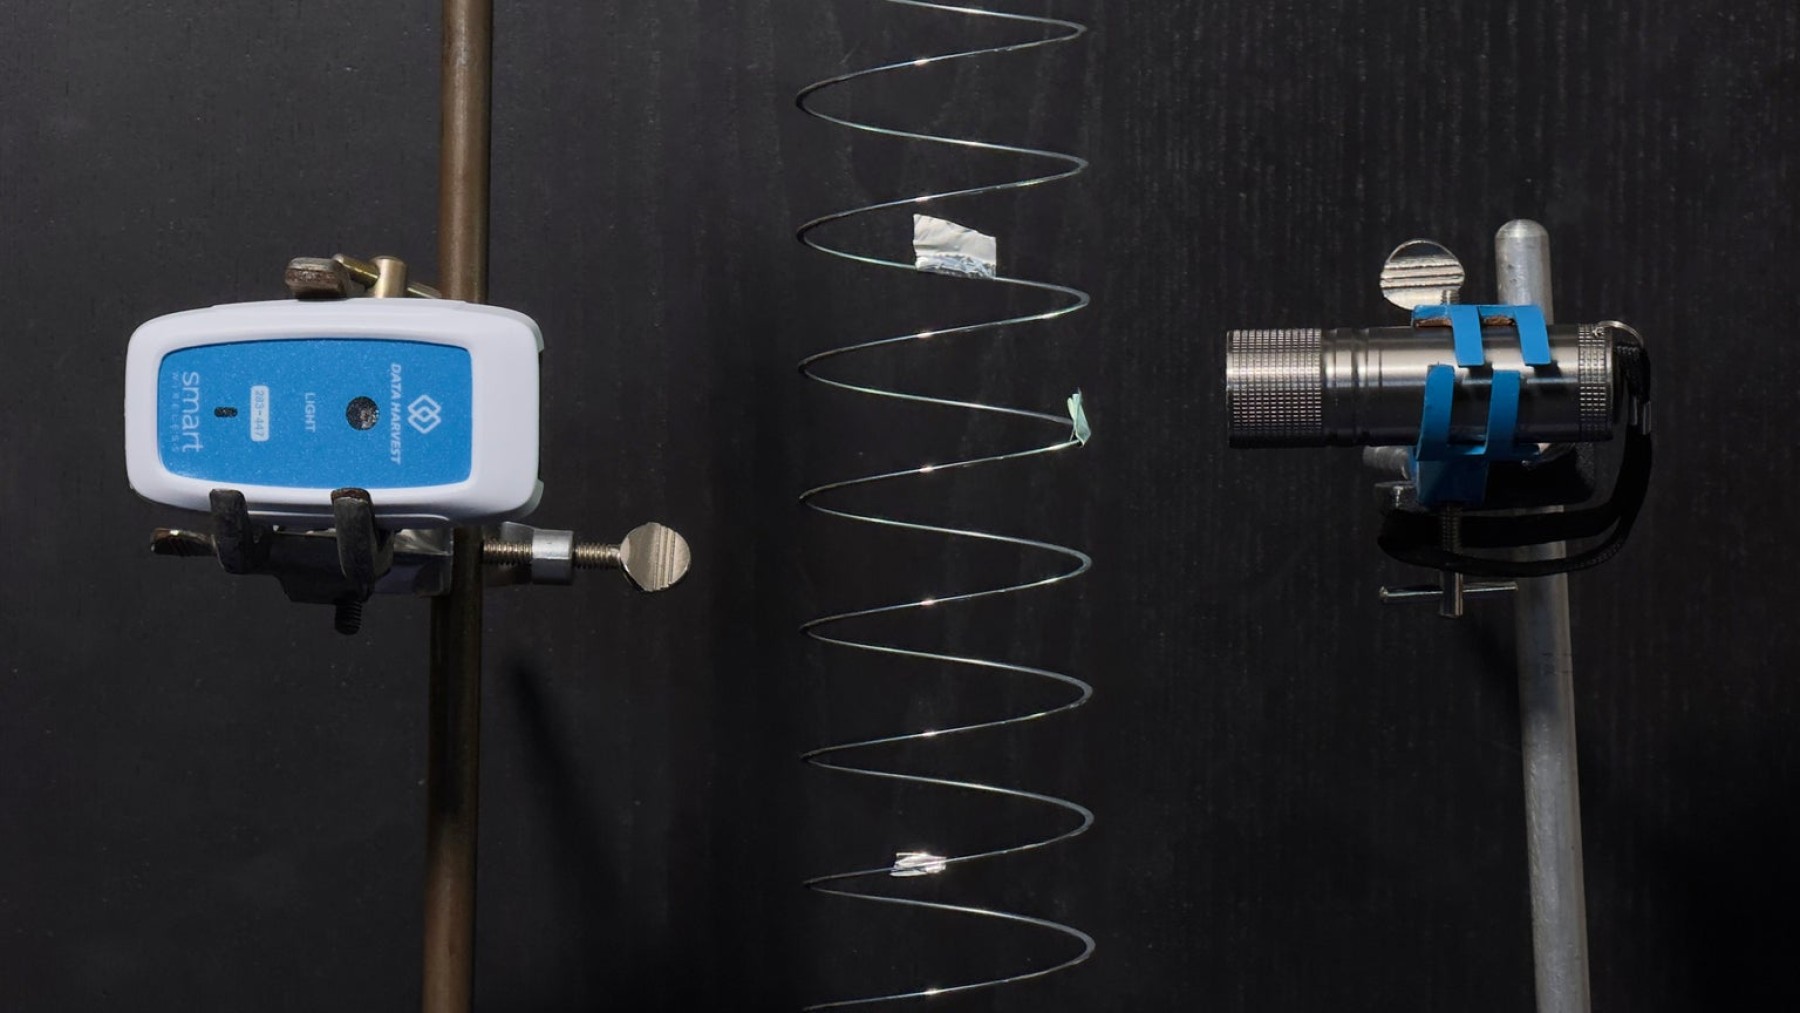
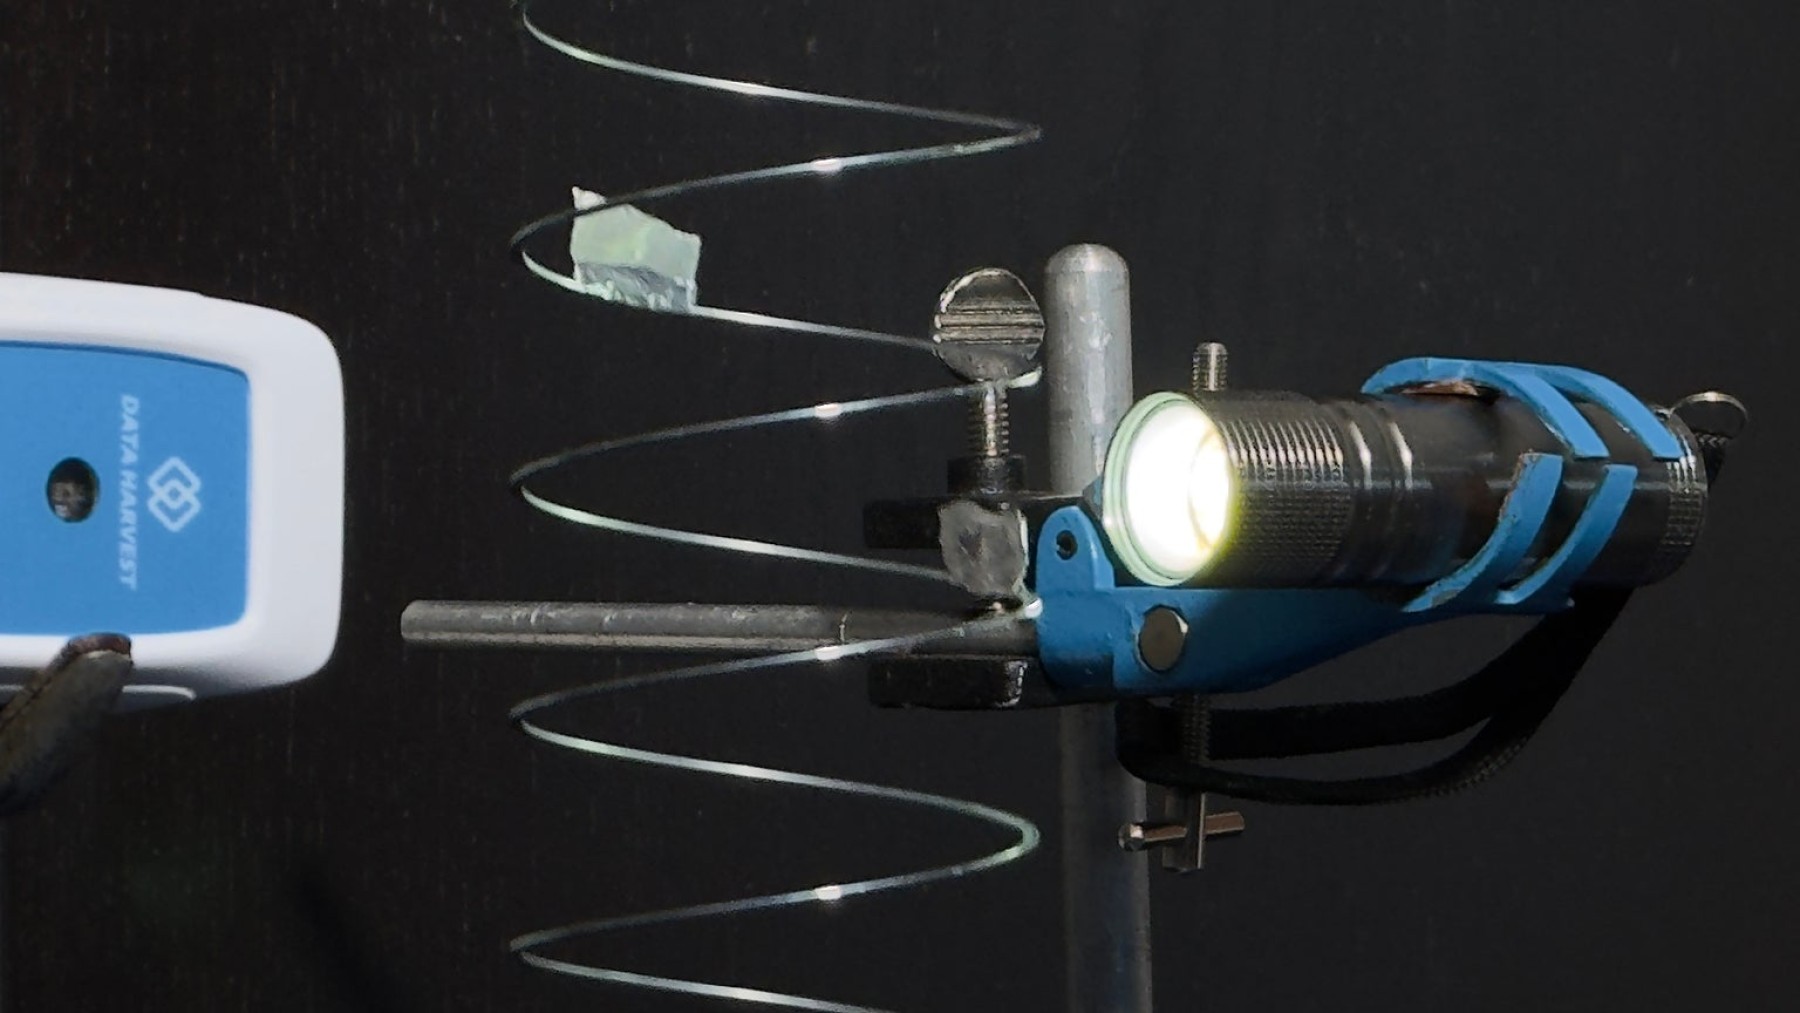
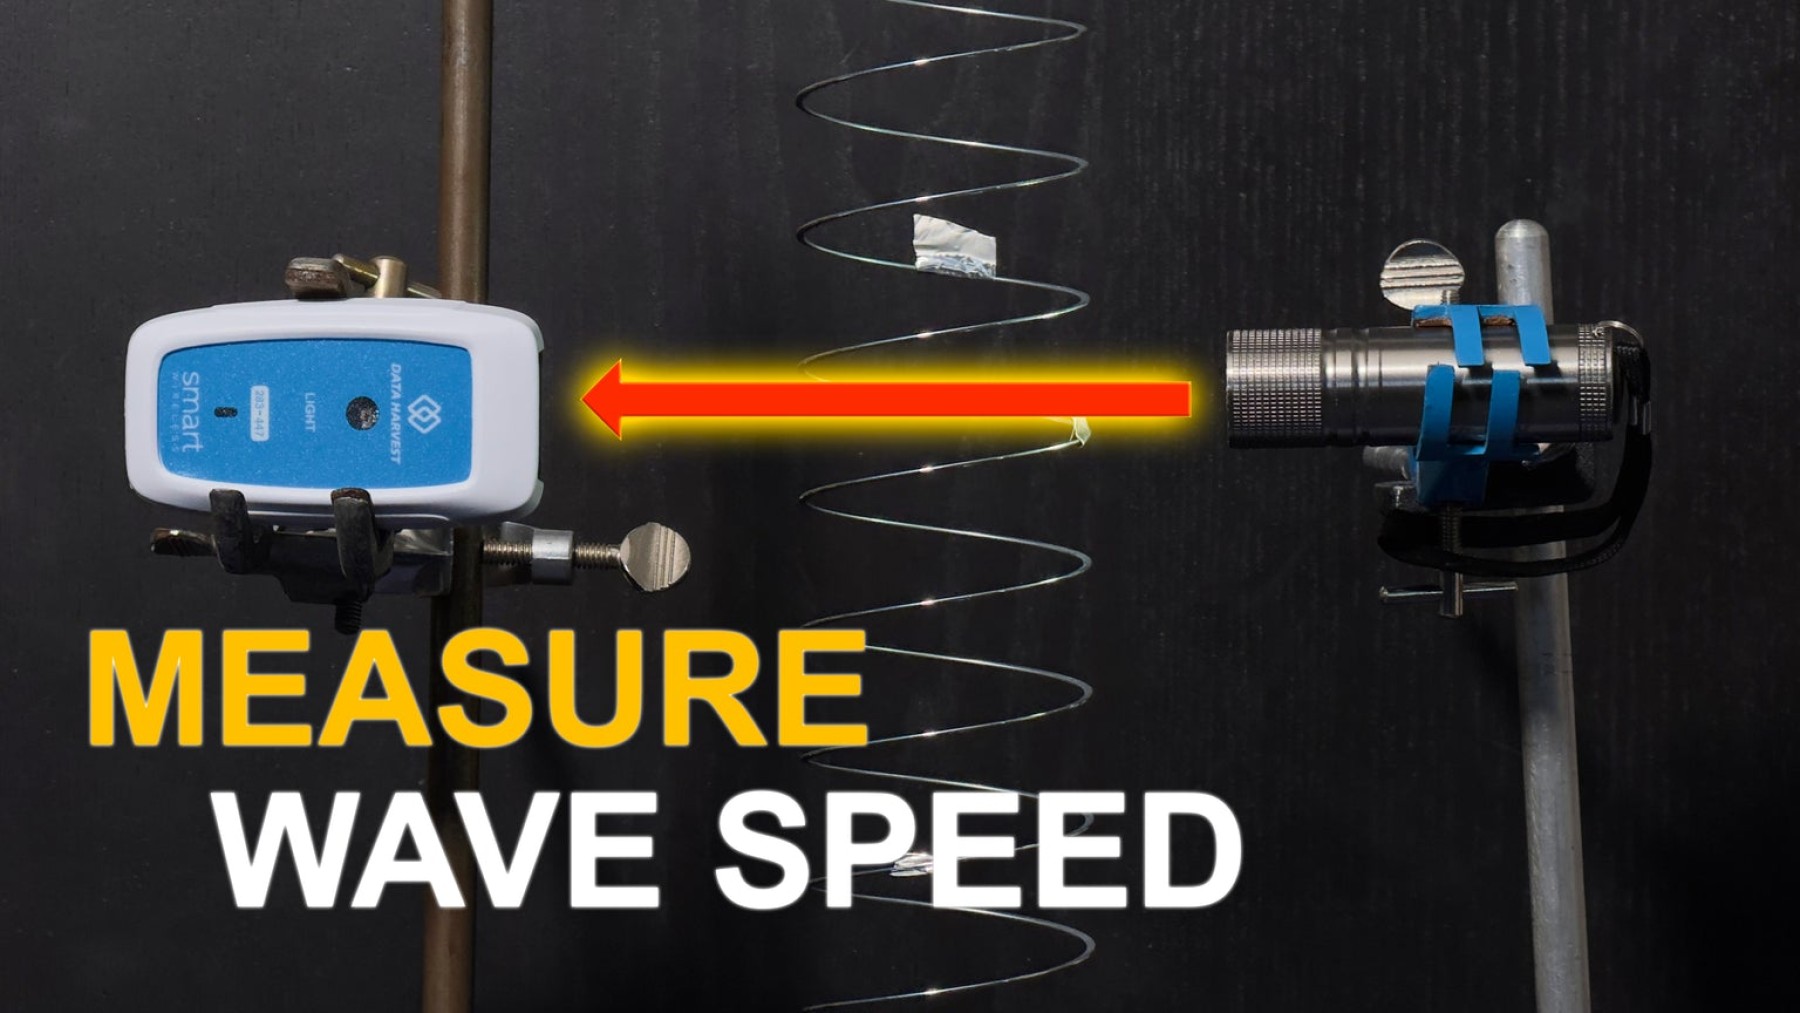
In this hands-on investigation, students use a slinky and a light sensor to measure the speed of longitudinal waves and explore how tension affects wave motion. It’s a brilliant way to bring abstract physics concepts to life using real data.

What’s the aim?

To measure the speed of a longitudinal wave in a slinky and investigate how wave speed changes with tension.

What you’ll need

  • Light and Colour Sensor (1160)
  • Slinky spring
  • Retort stand and clamp
  • Small card flag or tape marker
  • Mass hanger and slotted masses
  • Metre ruler or tape measure
  • EasySense software (Continuous mode)
  • A Light Source

How does it work?

A longitudinal wave travels through the slinky as a compression — where coils bunch together — followed by rarefaction, where they spread apart.

By measuring how long it takes for this compression wave to travel a known distance, students can calculate its speed.

v = d / t

Method

  1. Suspend the slinky vertically from a retort stand.
  2. Measure its length and calculate mass per unit length.
  3. Attach a small marker to a coil so it can pass through the light sensor.
  4. Position the light sensor a known distance from where the wave will be created.
  5. Set EasySense to Continuous recording (≈20 ms interval).
  6. Apply tension by hanging a known mass from the slinky.
  7. Generate a wave by compressing and releasing a section of the slinky.
  8. Record the time taken for the wave to reach the sensor.
  9. Repeat and calculate an average time.
  10. Increase the tension and repeat the process.

What do students discover?

As tension increases, the wave travels faster.

The relationship follows: v = √(T / μ)

Discussion points

  • Does your graph pass through the origin?
  • Why is v² proportional to tension rather than v?
  • How does this relate to real-world waves like sound?
  • What sources of error might affect your results?

Improve the investigation

  • Use a smaller marker to improve timing accuracy
  • Repeat measurements more times and average results
  • Ensure the slinky remains straight and vertical
  • Try using two sensors for greater accuracy

Safety first

  • Avoid overstretching the slinky
  • Ensure masses are securely attached
  • Keep hands and face clear of moving coils

Bring your lessons to life

Using Data Harvest’s Light Sensors and EasySense software, students can capture real-time data and visualise wave motion instantly.

Explore compatible sensors

DOWNLOAD THE FULL WORKSHEET HERE

More articles

Take a look at the following articles from the same topic.