INVESTIGATING LIGHT ENERGY, VOLTAGE & ROTATION WITH THE VU PRO DATA LOGGER
Published: Apr-2026 | Category: Fun With Science
Solar energy is one of the most important renewable energy sources in the world today. But how does light actually turn into useful energy?
In this engaging classroom experiment, students explore how light energy is converted into electrical and mechanical energy using a solar-powered windmill. By measuring both voltage output and rotation speed, learners can clearly see how energy transfer works in real time.
Using the powerful Vu Pro Data Logger, this investigation brings renewable energy concepts to life through hands-on data logging.
Learning Objectives
By the end of this activity, students will be able to:
Understand how solar panels convert light into electrical energy
Explain the relationship between electrical energy and motion
Investigate how distance and angle affect light intensity
Interpret data using real-time measurements
Identify links between renewable energy systems and real-world applications
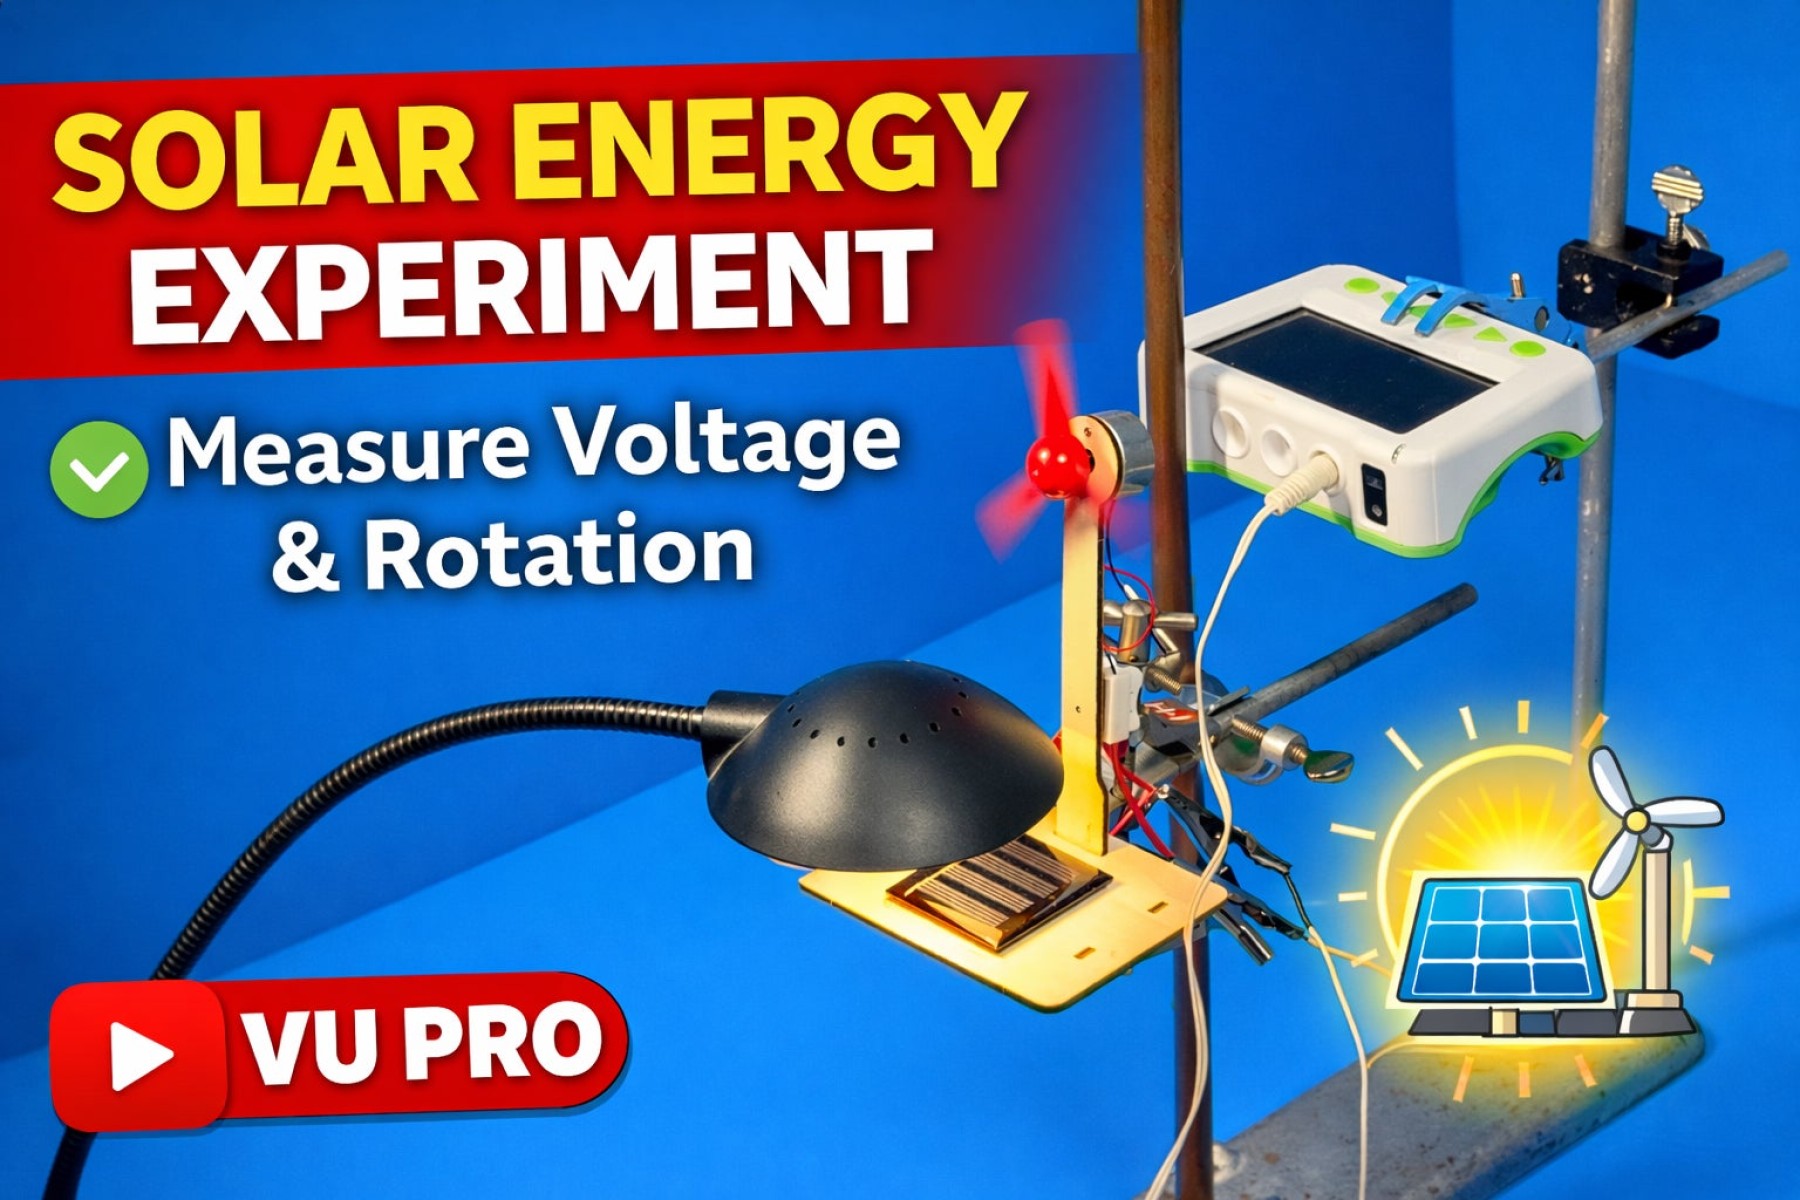
Set up the solar windmill so that it faces the lamp. The solar panel should be connected to the data logger to measure voltage output.
The lamp provides a consistent light source, allowing you to control:
Distance from the panel
Angle of the light
This setup allows students to explore how light intensity affects both electrical and mechanical outputs.
Method
Part A: Effect of Distance
Position the lamp directly in front of the solar panel (0° angle).
Place the lamp at 20 cm from the panel.
Turn on the lamp and allow readings to stabilise.
Record:
Voltage (V)
Rotation frequency (Hz or rpm)
Repeat three times and calculate an average.
Repeat for distances: 30 cm, 40 cm, 50 cm.
Part B: Effect of Light Angle
Keep the distance fixed at 20 cm.
Adjust the angle of the solar panel to:
0°
10°
20°
Record voltage and rotation frequency.
Repeat three times and calculate averages.
What’s Happening?
Solar panels convert light energy into electrical energy, which then powers a motor to produce mechanical motion.
Voltage represents electrical output
Rotation frequency represents mechanical output
Both outputs depend on light intensity, which is influenced by distance and angle.
Results & Observations
Students should observe that:
As distance increases, light intensity decreases, leading to lower voltage and slower rotation
As the angle increases, less light reaches the panel, reducing output
Maximum efficiency occurs when the panel is closest to the light source and directly facing it
There is a strong relationship between voltage and rotation speed
Questions to Explore
Why does voltage decrease as the light moves further away?
Why is performance highest at 0°?
How are electrical energy and motion connected?
Which measurement is more reliable—voltage or frequency?
How does this experiment relate to real solar energy systems?
Real-World Connections
This experiment mirrors how real solar panels work in everyday renewable energy systems:
Solar panels must be positioned for maximum light exposure
The angle of panels is adjusted to capture the most sunlight
Energy output depends heavily on environmental conditions
Understanding these principles helps students connect classroom science to renewable energy technologies used around the world.
Conclusion
This solar windmill investigation provides a clear and measurable way to explore energy conversion. By combining voltage and motion data, students gain a deeper understanding of how renewable energy systems operate.
With the Vu Pro Data Logger, learners can visualise energy changes in real time, making abstract concepts tangible, engaging and highly relevant.