Published: Sep-2026 | Category: Primary Science
Switch on a data logger, clap your hands and watch the reading change. That simple moment can be a brilliant introduction to classroom data logging: pupils do something, see an immediate response and begin asking why it happened.
Data logging does not need to start with complicated equipment or a perfect graph. The best first activities use familiar objects, a clear question and one measurement that pupils can understand. These ten experiments have been selected from our primary science activities because they build confidence step by step.
The first activities use the sensors built into the Vu Pro Primary Data Logger. Later experiments introduce a plug-in temperature sensor, EasySense software, accurate timing and longer recordings. You can begin with a quick whole-class demonstration and add more independent investigation as everyone becomes familiar with the equipment.
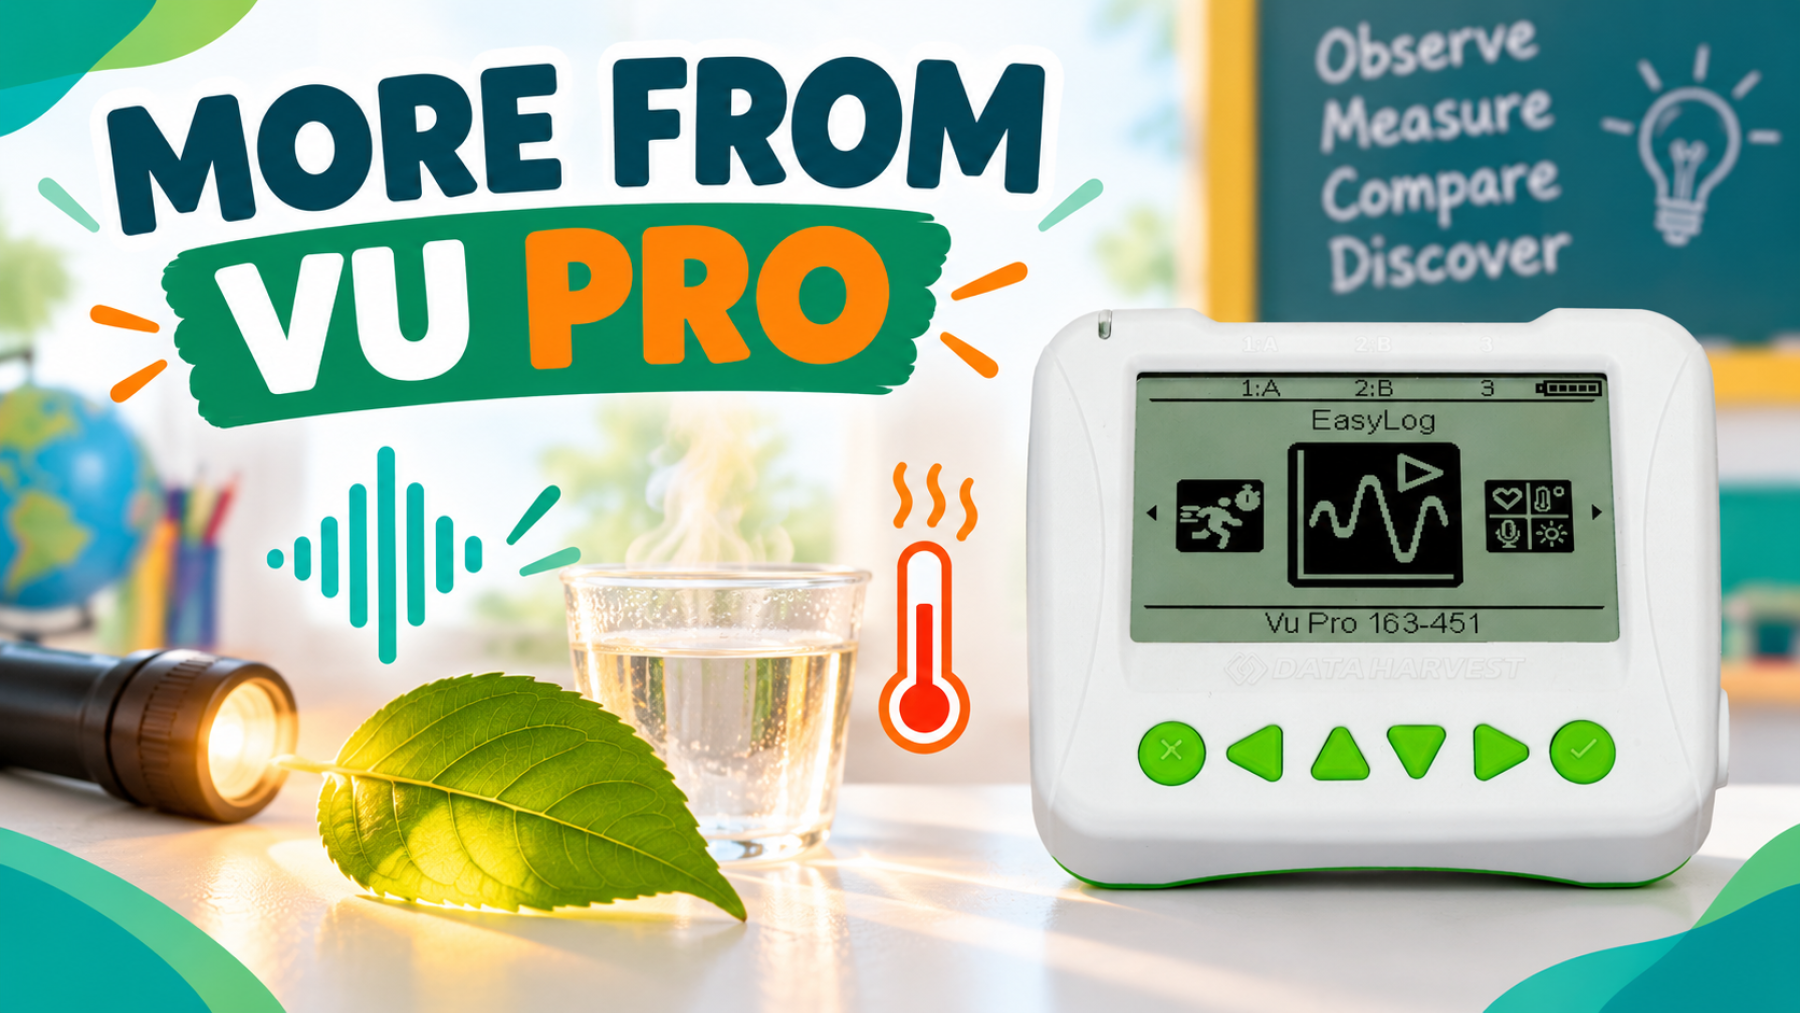
The Vu Pro range has been designed for primary science. Vu Pro includes built-in light, sound, temperature and heart rate sensors, a clear screen and simple controls. It can display live readings on its own, store data for later or connect to EasySense by USB or Bluetooth.
For your first lesson, you only need to understand three simple ways of working:
You do not need to use every feature at once. Let the scientific question decide which display will make the result easiest for pupils to understand.
Question: Which classroom sounds are loudest and quietest?
This is probably the easiest place to begin. Select the sound sensor in Meter mode, then ask pupils to try clapping, clicking their fingers, speaking or using different percussion instruments. The live reading changes immediately, connecting the sound they hear with a value they can compare.
What pupils learn: sound level can be measured, different sounds produce different readings, and distance and direction can affect a measurement.
Beginner tip: start with the Vu Pro screen before connecting to EasySense. Once pupils understand the changing number, show the same data as a gauge or pictogram.
Question: Where is the brightest place in the classroom?
Use the built-in light sensor in Meter mode. Point it towards a window, turn it towards a darker corner and cover it with a hand or piece of fabric. Pupils can see the reading rise and fall as the amount of light reaching the sensor changes.
What pupils learn: light levels can be measured, a sensor responds to changes in its surroundings, and careful positioning matters.
Beginner tip: keep the logger facing the same direction while comparing places. This introduces consistency without needing to explain every part of a fair test.
Question: Which fabric blocks the most light?
Place a torch and the Vu Pro in fixed positions. Put one sample of fabric between them and use Snapshot mode to save a light reading. Repeat with fabrics of the same size, then compare the results in a table or bar chart.
What pupils learn: some materials let more light through than others, individual readings can be compared, and a fair test means changing one thing at a time.
Beginner tip: take a reading with no fabric first. This gives pupils a useful control measurement to compare with every sample.
Question: Which material is the best sound insulator?
Place a steady sound source, such as a buzzer or alarm clock, inside a box. Measure its sound level without insulation, then surround it with materials such as fabric, cotton wool, shredded paper or polystyrene and take a Snapshot reading for each one.
What pupils learn: materials affect how sound travels, predictions can be tested with evidence, and results can be ranked or displayed as a bar chart.
Beginner tip: keep the sound source, box and logger in exactly the same positions. Background noise can affect the sensor, so choose a reasonably quiet space.
Question: How does the sensor respond to warm and cold water?
Connect a Vu Temperature Sensor and show its reading in Meter mode. Place the probe tip into a stable container of warm water, wait for the value to settle and then move it into cold water.
What pupils learn: temperature is measured in degrees Celsius, a temperature sensor takes time to respond, and its sensitive tip must make good contact with the material being measured.
Beginner tip: ask pupils to predict what will happen before moving the probe. Unlike the light and sound readings, the temperature changes gradually, which makes this a useful introduction to response time.
Question: Can pupils work out when a temperature sensor was in warm water, cold water or the air?
Connect Vu Pro to EasySense and record a continuous line graph. Move the plug-in temperature sensor between a container of warm water, a container of cold water and the desk. One group can control the sensor while another group watches the graph and describes what is happening.
What pupils learn: a line graph shows change over time, rising and falling lines have meaning, and evidence can be used to reconstruct a sequence of events.
Beginner tip: leave the sensor in each place long enough to create recognisable sections on the graph. Afterwards, ask pupils to label the warm, cold and room-temperature sections.
Question: Which material is the best thermal insulator?
Fill two matching containers with equal amounts of warm water and place a temperature sensor in each. Wrap one container in a chosen material and leave the other uncovered. Record both temperatures together to see which one cools more slowly.
What pupils learn: some materials reduce heat loss more effectively than others, two sets of data can be compared on the same graph, and careful control of variables makes a comparison more reliable.
Beginner tip: test one material against the uncovered container first. Different groups can then test different materials and combine their findings as a class.
Question: Does the heart beat at the same rate before and after activity?
Use the heart rate sensor built into Vu Pro to record a short resting measurement. Repeat after a brief, suitable activity and compare the readings or waveforms. Pupils can count peaks over a known period and use them to calculate beats per minute.
What pupils learn: the pulse can be measured, heart rate changes in response to activity, and repeated patterns on a graph can represent individual heartbeats.
Beginner tip: a warm, still finger gives a clearer reading. Treat measurements as private classroom data, invite volunteers rather than requiring participation, and avoid turning the activity into a competition over who has the highest or lowest result.
Question: Does a cart take less time to travel down a steeper slope?
Connect the magnetic switches on the Vu Timing Ramp Set to inputs A and B. Use Timing mode so the first switch starts the measurement and the second stops it. Release the cart from the same position and compare several ramp heights.
What pupils learn: electronic timing can measure a short event accurately, a steeper slope changes the cart's motion, and repeated tests help reveal whether a result is consistent.
Beginner tip: compare travel times before introducing calculations. Older pupils can measure the distance between the switches and calculate average speed using distance divided by time.
Question: When is the classroom warmest, coolest, brightest or darkest?
Set Vu Pro to EasyLog and leave it in a secure position to record light and temperature over a lesson, lunchtime or a full day. Import the saved data into EasySense and look for changes that match familiar events, such as lights being switched off, sunlight reaching the window or the room becoming empty.
What pupils learn: a data logger can collect evidence automatically, graphs can reveal events that happened while nobody was watching, and more than one sensor can help explain a pattern.
Beginner tip: begin with a short, predictable period such as lunchtime. Ask pupils to sketch the graph they expect before revealing the recorded data.
The technology should make the science easier to see. Keep the first question small, allow time to talk about unexpected readings and encourage pupils to repeat measurements when something does not look right.
A successful first data logging lesson does not need lots of equipment or complicated analysis. If pupils can make a prediction, change one thing, collect a clear measurement and explain what the result suggests, they are already working scientifically.
As confidence grows, the same equipment can move from live numbers to tables, bar charts, line graphs and longer investigations. Explore the primary teaching materials for more ideas and guidance.
The Primary Activities Vu Pro guide contains teacher notes, learning objectives, equipment lists, classroom suggestions and pupil instructions for these investigations and many more.
Take a look at the following articles from the same topic.