Published: Sep-2026 | Category: Primary Science
A data logger can do much more than record a number. Used well, it can help children notice changes, compare places, spot patterns and support their ideas with evidence.
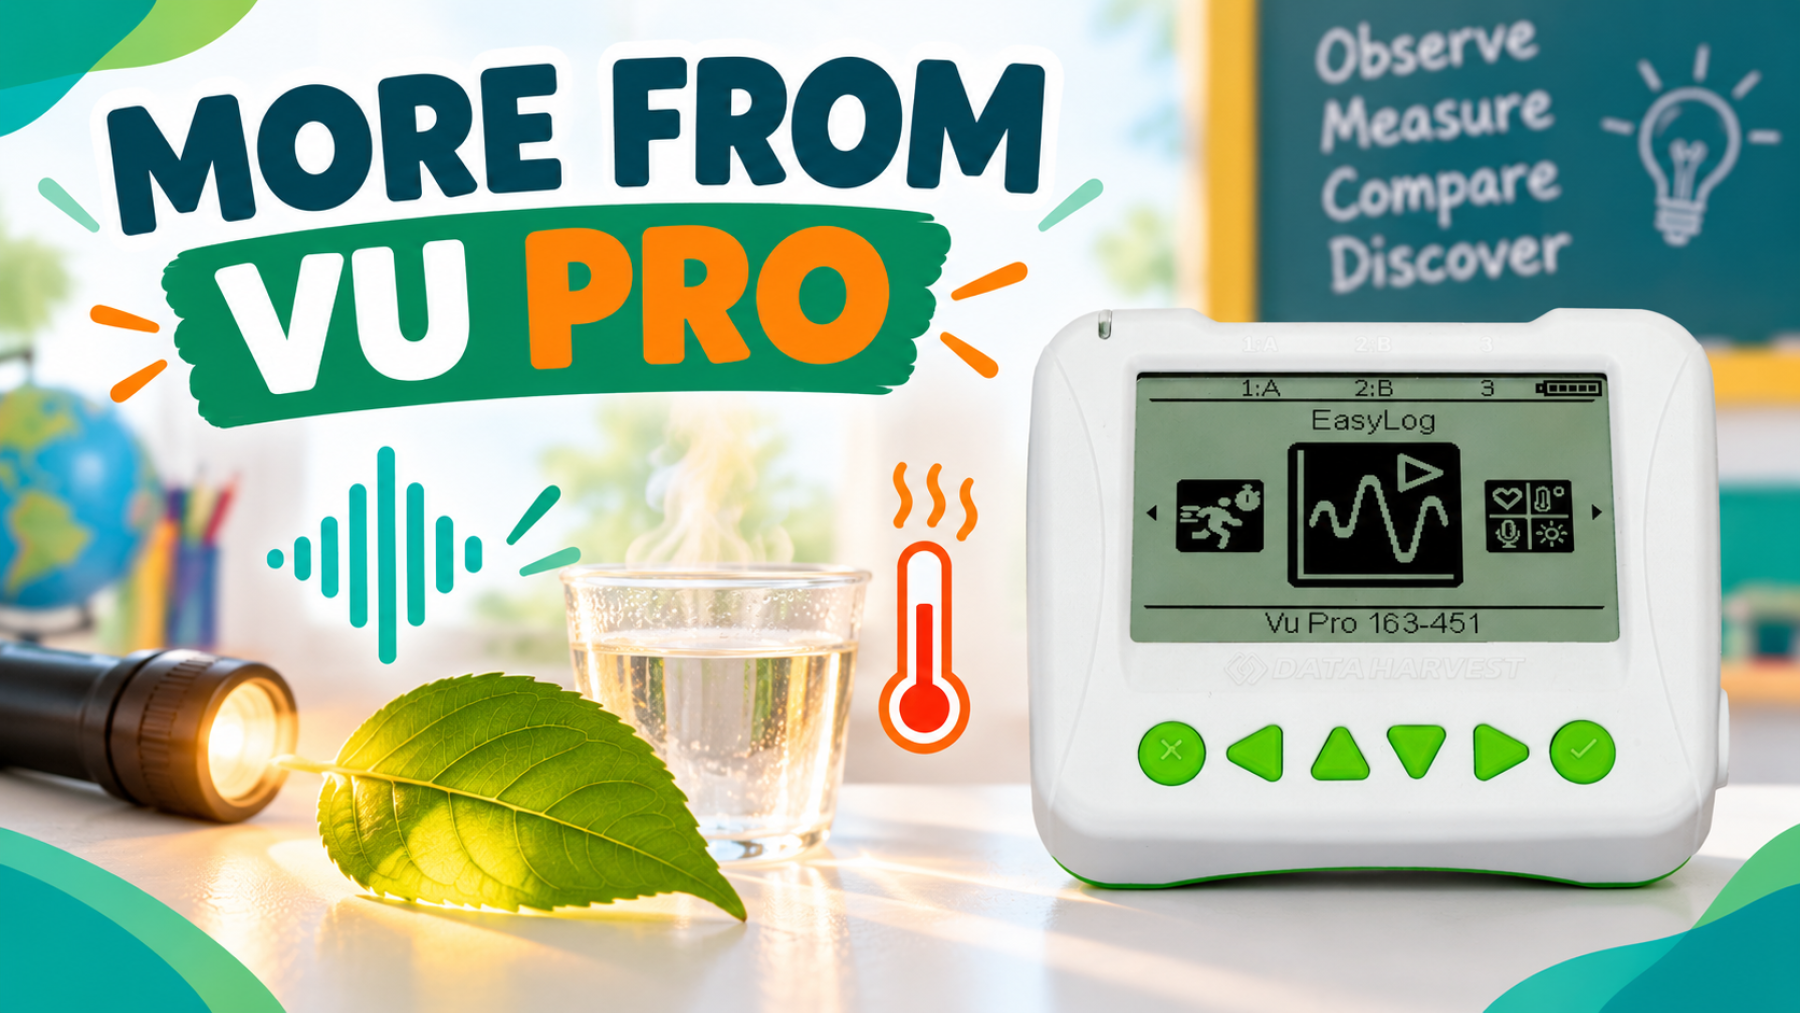
The Vu Pro primary data logger has built-in light, temperature, sound and heart rate sensors, so there is plenty to investigate before you connect any additional equipment. It can also display and store readings without being connected to a computer, making it easy to move between the classroom, playground and school grounds.
Here are some practical ways to get more from Vu Pro across primary science, maths and wider curriculum activities.
The most useful investigations usually begin with a question children can understand and test. Instead of saying, “Today we are using the light sensor,” try asking:
This gives the data a purpose. Children are not simply collecting readings; they are gathering evidence to answer a question.
Vu Pro includes several ways to collect and view data. Choosing the right one can make an activity easier for children to understand:
Begin with live numbers or pictograms, then move towards tables and graphs as pupils become more confident. This creates a natural progression from observing a change to interpreting a pattern.
Ask groups to predict which parts of the classroom will be brightest and darkest. They can use the built-in light sensor and Snapshot mode to take readings beside a window, under a table, near the door and in different corners of the room.
Mark the results on a simple classroom plan or arrange them in a table. Children can then compare the measurements with their predictions and discuss why the readings differ. Repeat the activity at another time of day to explore whether the pattern changes.
Place a torch at a fixed position and use the built-in light sensor to compare readings at measured distances. Keep the angle of the torch and the surrounding light as consistent as possible.
This is a useful opportunity to talk about fair testing. Which variable are we changing? What must stay the same? A line graph can help children see that light intensity does not simply disappear; it changes with distance.
Take Vu Pro on a short walk around the school grounds and compare air temperature in sunny, shaded, sheltered and open locations. Allow the reading time to settle at each point and avoid warming the logger with hands or placing it directly on hot or cold surfaces.
Children can link their findings to habitats, weather and seasonal change. They might investigate whether a wall, hedge or tree creates a different local environment, then suggest how this could affect plants and small animals.
A graph often reveals more than a single temperature reading. Connect the Vu Temperature Sensor and record how warm water cools, how an ice cube affects nearby water or how insulation changes the rate of cooling.
Ask children to describe the shape of the graph before calculating anything. Where did the temperature change fastest? When did it begin to level out? Which test produced the clearest difference?
Use the built-in sound sensor to compare different locations or times of day. Pupils could collect readings in the library, classroom, corridor, playground and dining hall, then arrange the results from quietest to loudest.
The aim is not to find the loudest possible sound. It is to compare ordinary environments consistently. Discuss whether one reading is enough and how repeated measurements could make the conclusion more reliable.
Clap a simple rhythm, tap different everyday materials or compare quiet and loud sounds while watching the live display. Children can look for peaks, gaps and repeated patterns in the recorded data.
This works well as a link between science and music. Can another group recreate a rhythm by looking at its graph? What information does the graph show, and what can it not tell us?
The built-in heart rate sensor can help children explore how the body responds to activity. Compare a resting reading with readings after a short, suitable activity, then observe how the value changes during recovery.
Focus on patterns rather than competition. Children can ask whether heart rate returns towards its starting value and whether different types of activity produce similar results. Individual readings should be treated sensitively and used for learning, not for medical assessment.
Because Vu Pro can store data in its own memory, it can capture changes while the class gets on with other work. Record light or classroom temperature across a lesson, through lunchtime or over the school day, then inspect the graph afterwards.
Ask pupils to annotate possible events: blinds being opened, people entering the room, heating switching on or sunlight moving past a window. This helps children connect a graph with events in the real world while recognising that a graph alone may not explain every change.
Timing activities are a simple way to combine science and maths. Children might compare the time taken to walk, hop or move a toy vehicle over a fixed distance. They can repeat each test, look for variation and decide whether a mean would be useful.
For more controlled investigations, Vu Pro can be extended with equipment such as Vu Push Button Switches, light gates or the Vu Timing Ramp Set. The three external sensor inputs also allow teachers to develop more ambitious activities as pupils’ confidence grows.
Once children understand how to take a reading, give them a familiar object or location and ask them to create their own testable question. A simple planning frame can help:
This shifts the emphasis from following instructions to working scientifically. Even a small investigation can develop questioning, prediction, measurement, pattern-seeking and evaluation.
Vu Pro can be used independently for quick classroom work. When pupils are ready to explore their results in greater depth, connect it by USB or Bluetooth to the EasySense2 app.
Children can view data as numbers, tables, pictograms, bar charts or line graphs, add titles, inspect individual points and compare repeated runs. Try asking three questions whenever a graph appears:
Supervise practical work and choose activities appropriate for the pupils, environment and school risk assessment. Keep the Vu Pro itself dry; use the external temperature probe for investigations involving water. Use warm rather than very hot water, avoid very bright light sources, keep sound at comfortable levels and choose moderate physical activity suitable for the children taking part.
Getting more from Vu Pro does not mean making every lesson more complicated. It means using the right sensor and display to help children answer a worthwhile question. Begin with quick comparisons, build towards graphs over time and then give pupils more control over the enquiry. The result is data that children can see, discuss and use as evidence.
Explore ready-made ideas for light, sound, temperature, heart rate, timing and more, with guidance to help you plan practical primary science lessons.
Find and download activities in Practical Explorer
You can also browse the Vu Pro primary teaching materials for additional classroom support.
Take a look at the following articles from the same topic.