Sensors
Wireless Bluetooth Sensors
Wireless Sensor Packs
Wired SmartQ Sensors
Vu Primary Sensors
Loggers & Interfaces
V-Log Pro Data Logger New
Vu Pro Primary Data Logger New
Dynamics Systems
Wireless Dynamics
Basic Dynamics (No Sensors)
Science Accessories
General Accessories
Dynamics Accessories
Teaching Resources
Primary Teaching Materials
Primary Video Academy
Secondary Teaching Materials
Secondary Video Academy
Other
EasySense App
Blogs
Support Pages
Legacy Products
Product Manuals
Primary Teaching Resources
Secondary Teaching Resources
Practical Explorer
Find experiments by sensors, topic or discipline
Product Support
Support Overview
Help & Knowledge
Knowledgebase
Returns & Repairs
Warranty Information
Our latest news, tips, tricks, and science data logging posts!
Random or Not? Investigating Patterns in Repeating Events
Secondary Science
Use push button switches and EasySense2 to record repeated events, compare regular and irregular patterns, and explore randomness using best fit.
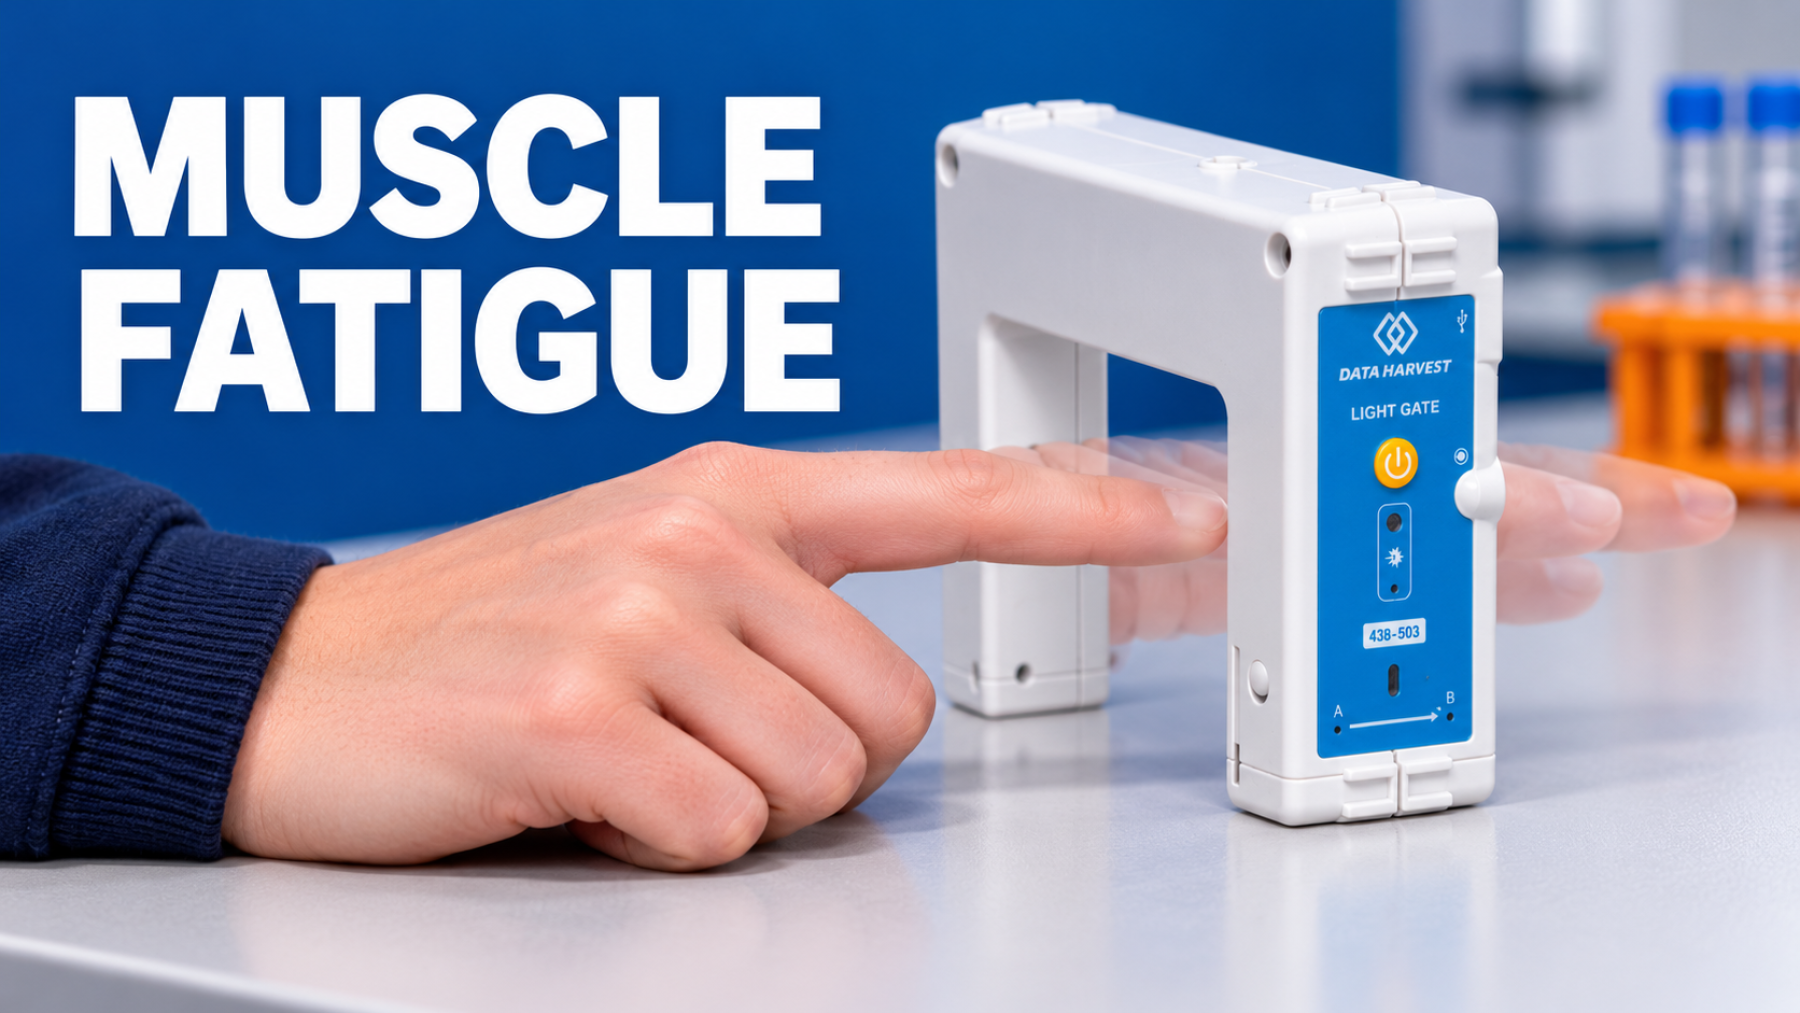
Muscle Fatigue Light Gate Experiment
Investigate muscle fatigue by measuring finger movement with a Wireless Light Gate, then compare how warming and cooling the hand affect performance.
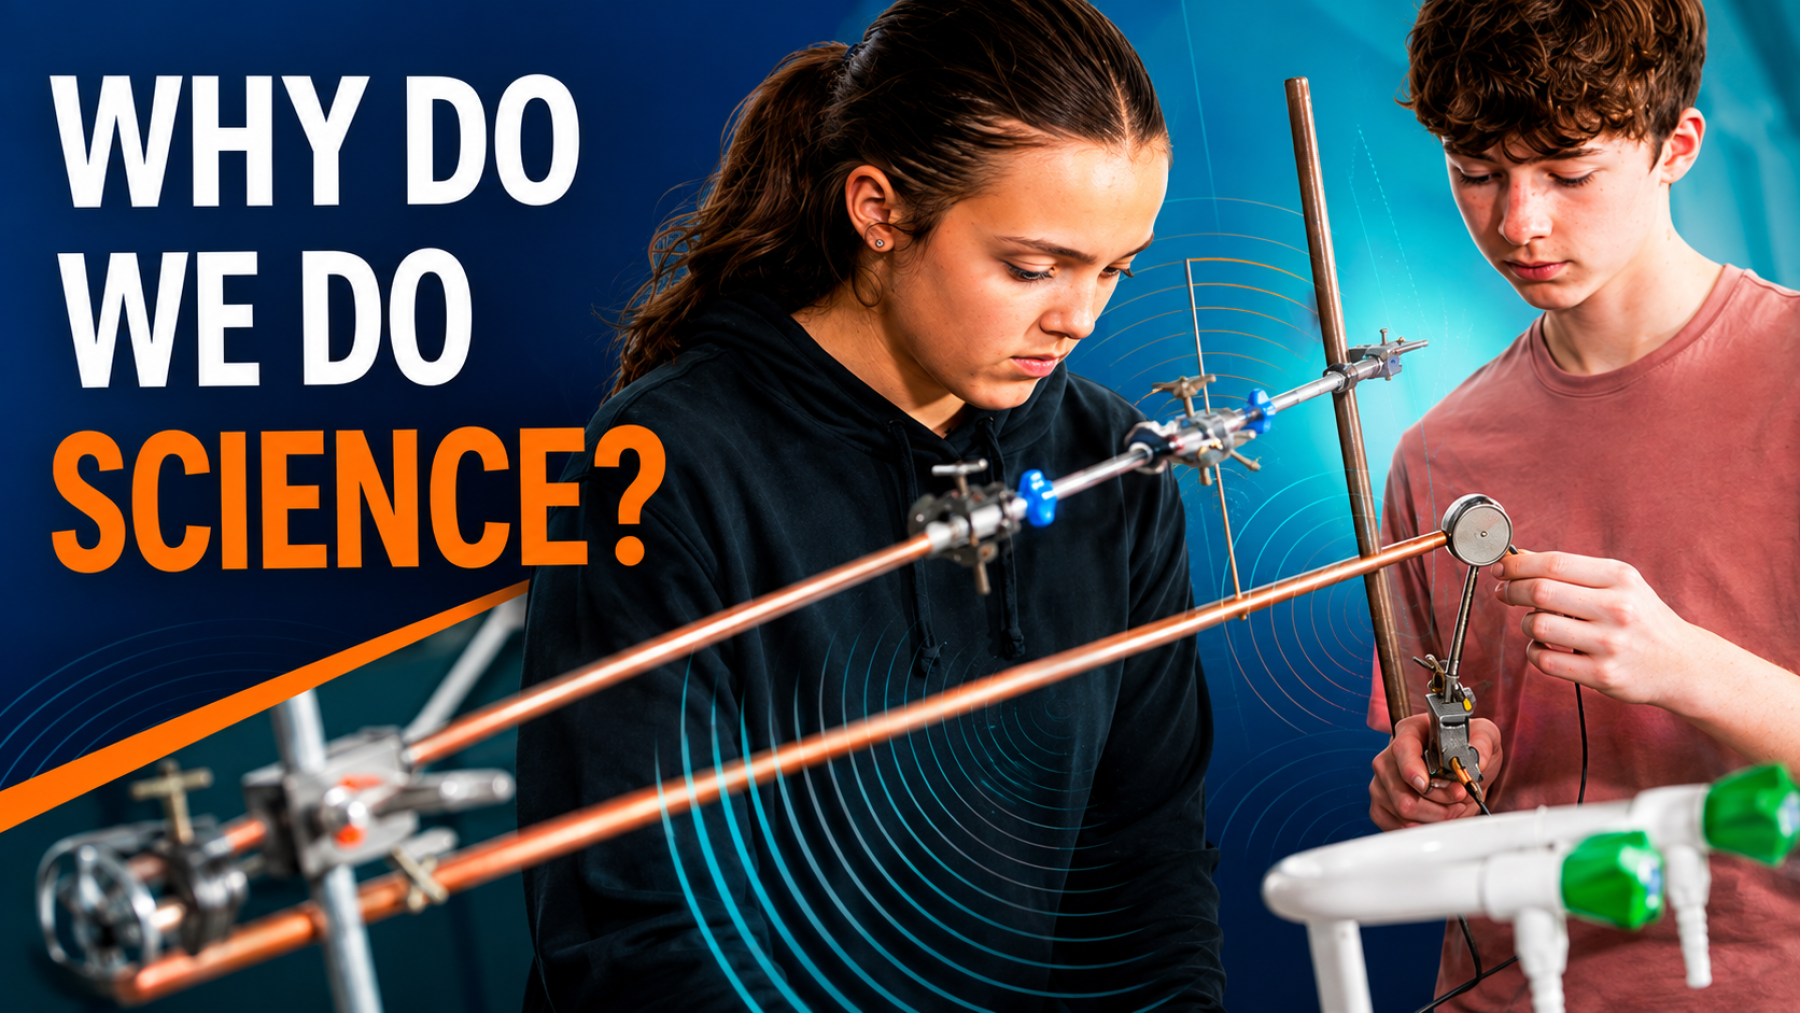
Why Do We Do Science? From Curiosity to Evidence
Explore why we use the scientific method, how evidence improves explanations, and how classroom data logging turns questions into testable ideas.
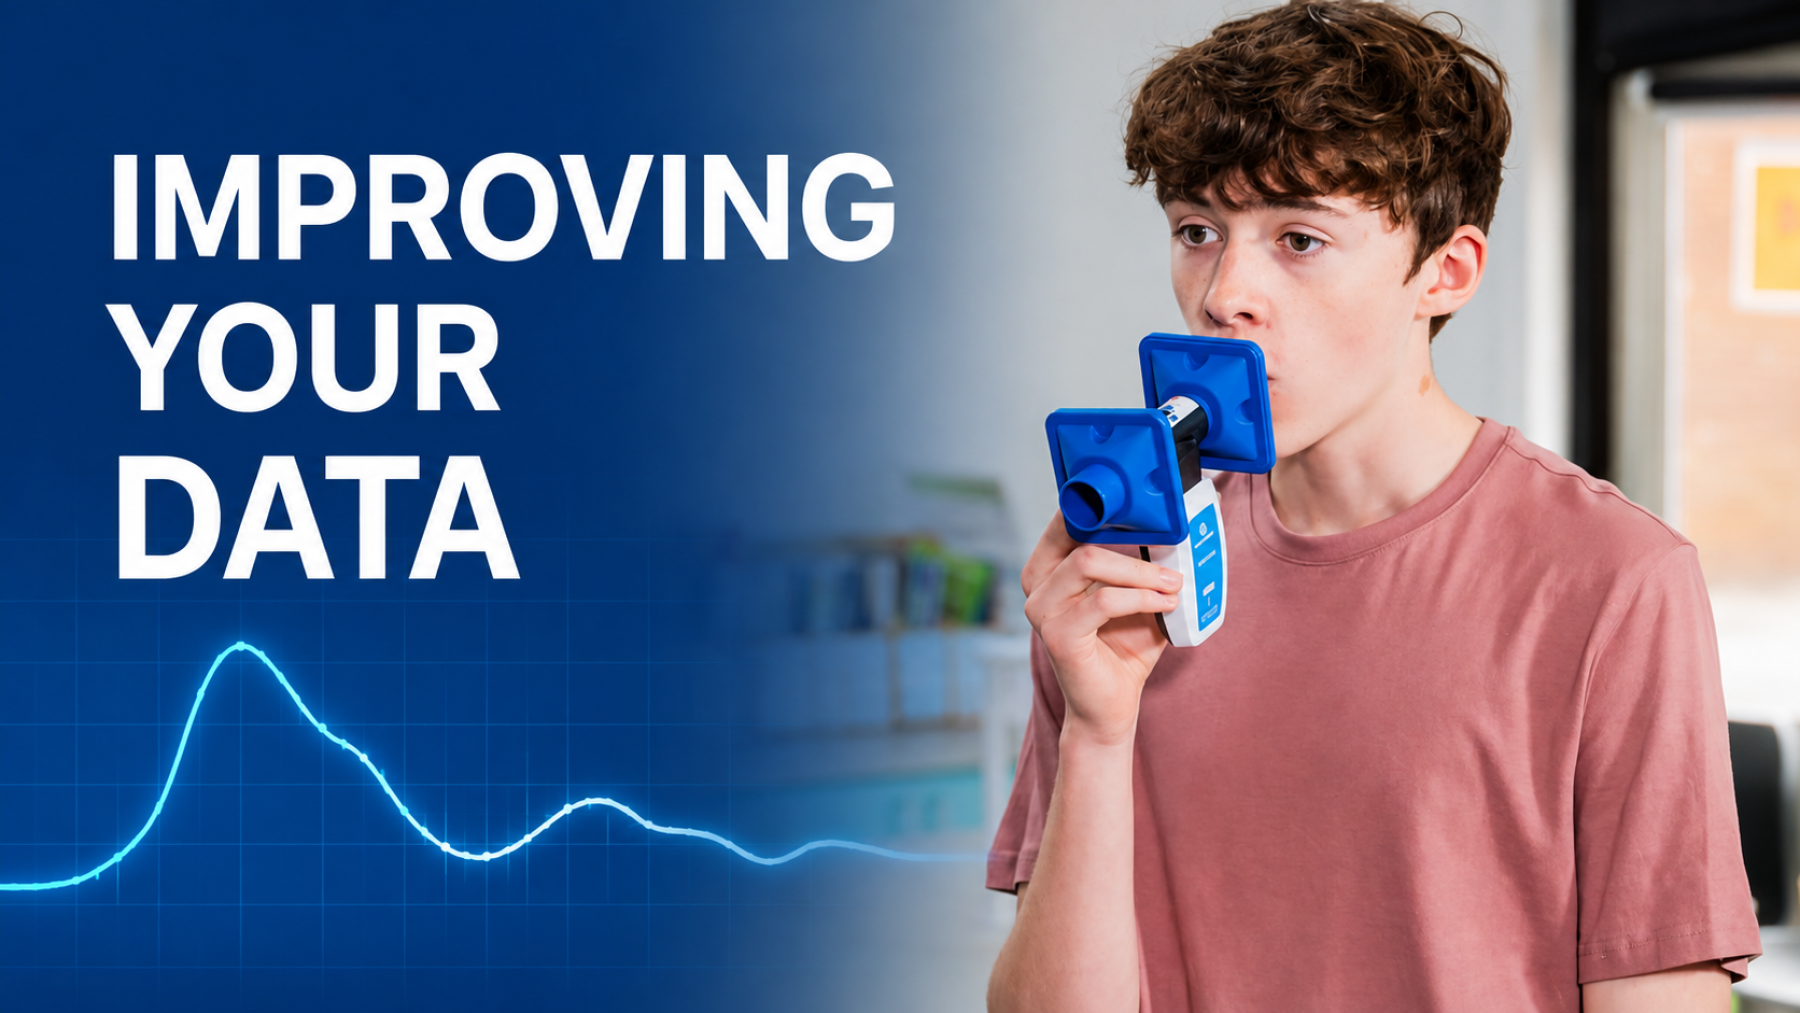
Improving Scientific Data in Classroom Experiments
Help students collect stronger scientific evidence by choosing the right sensor, sampling rate and analysis, with clear classroom examples and statistics.
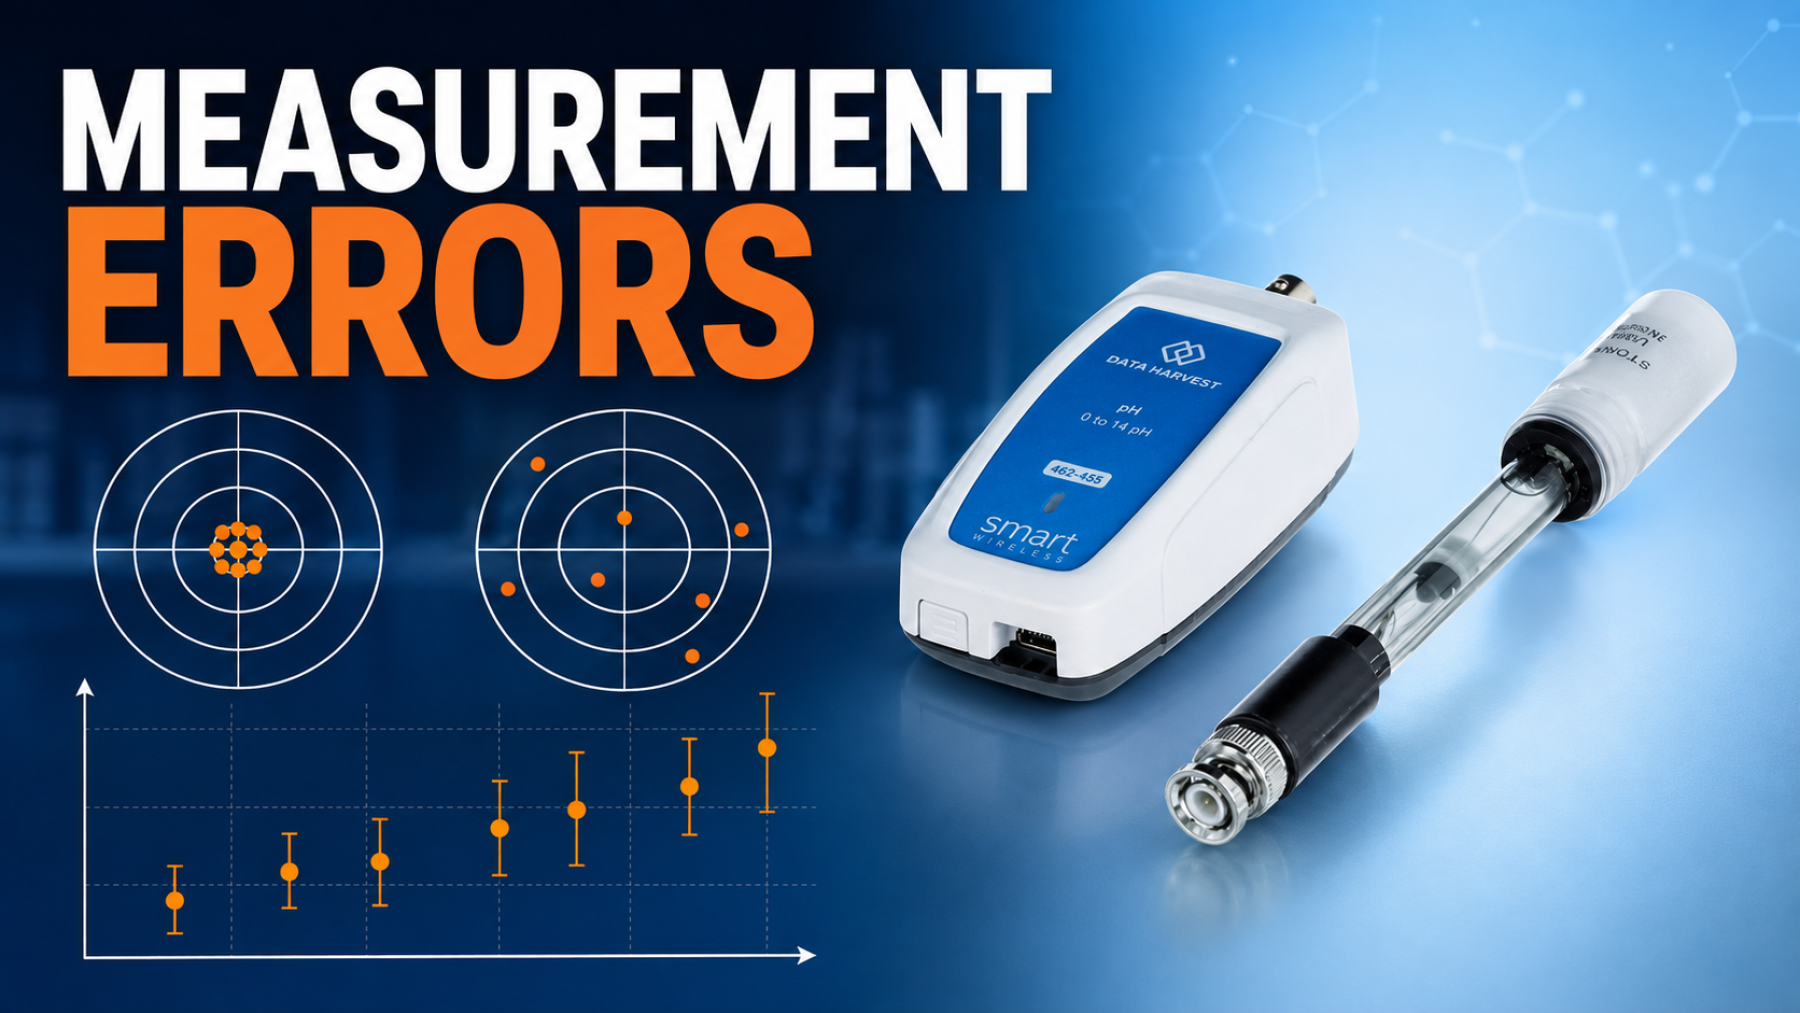
Measurement Errors in Science: How to Improve Data
Help students understand accuracy, precision, systematic and random error, then use statistics and graphs to improve scientific measurements.
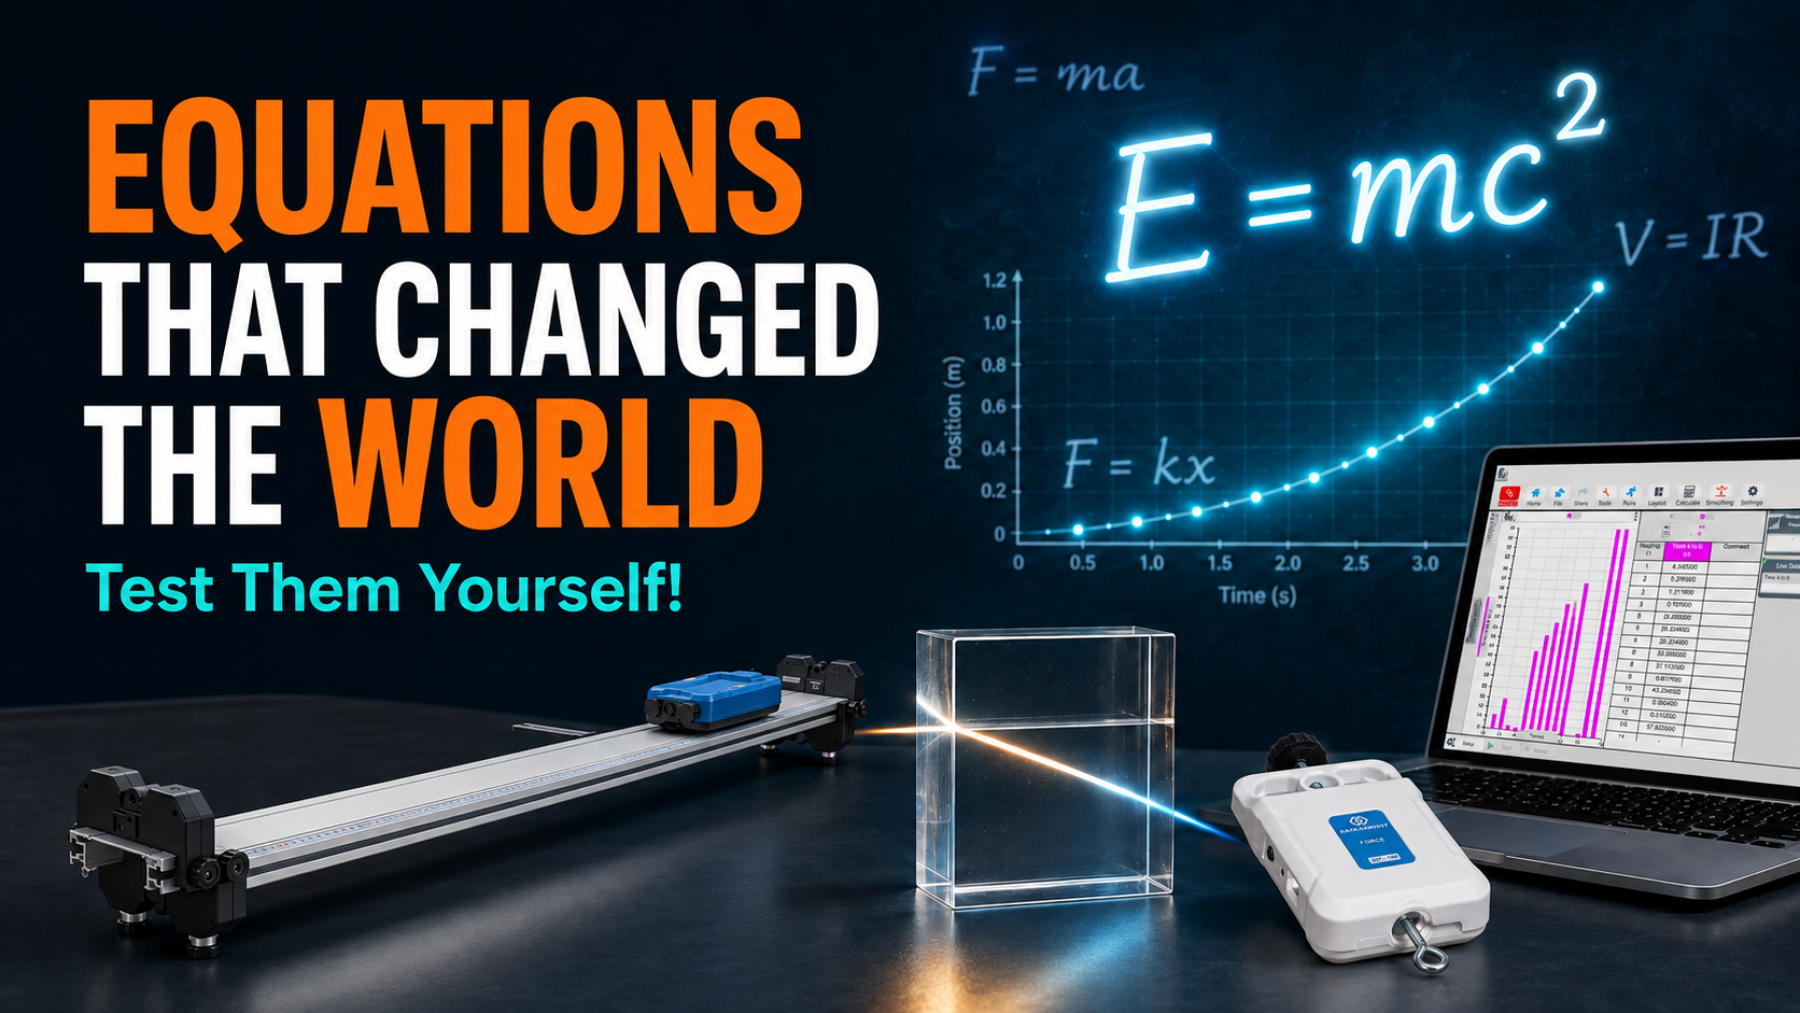
10 Scientific Equations Students Can Test in the Lab
Explore 10 important scientific equations through practical school experiments using sensors, data logging and real-time graph analysis.
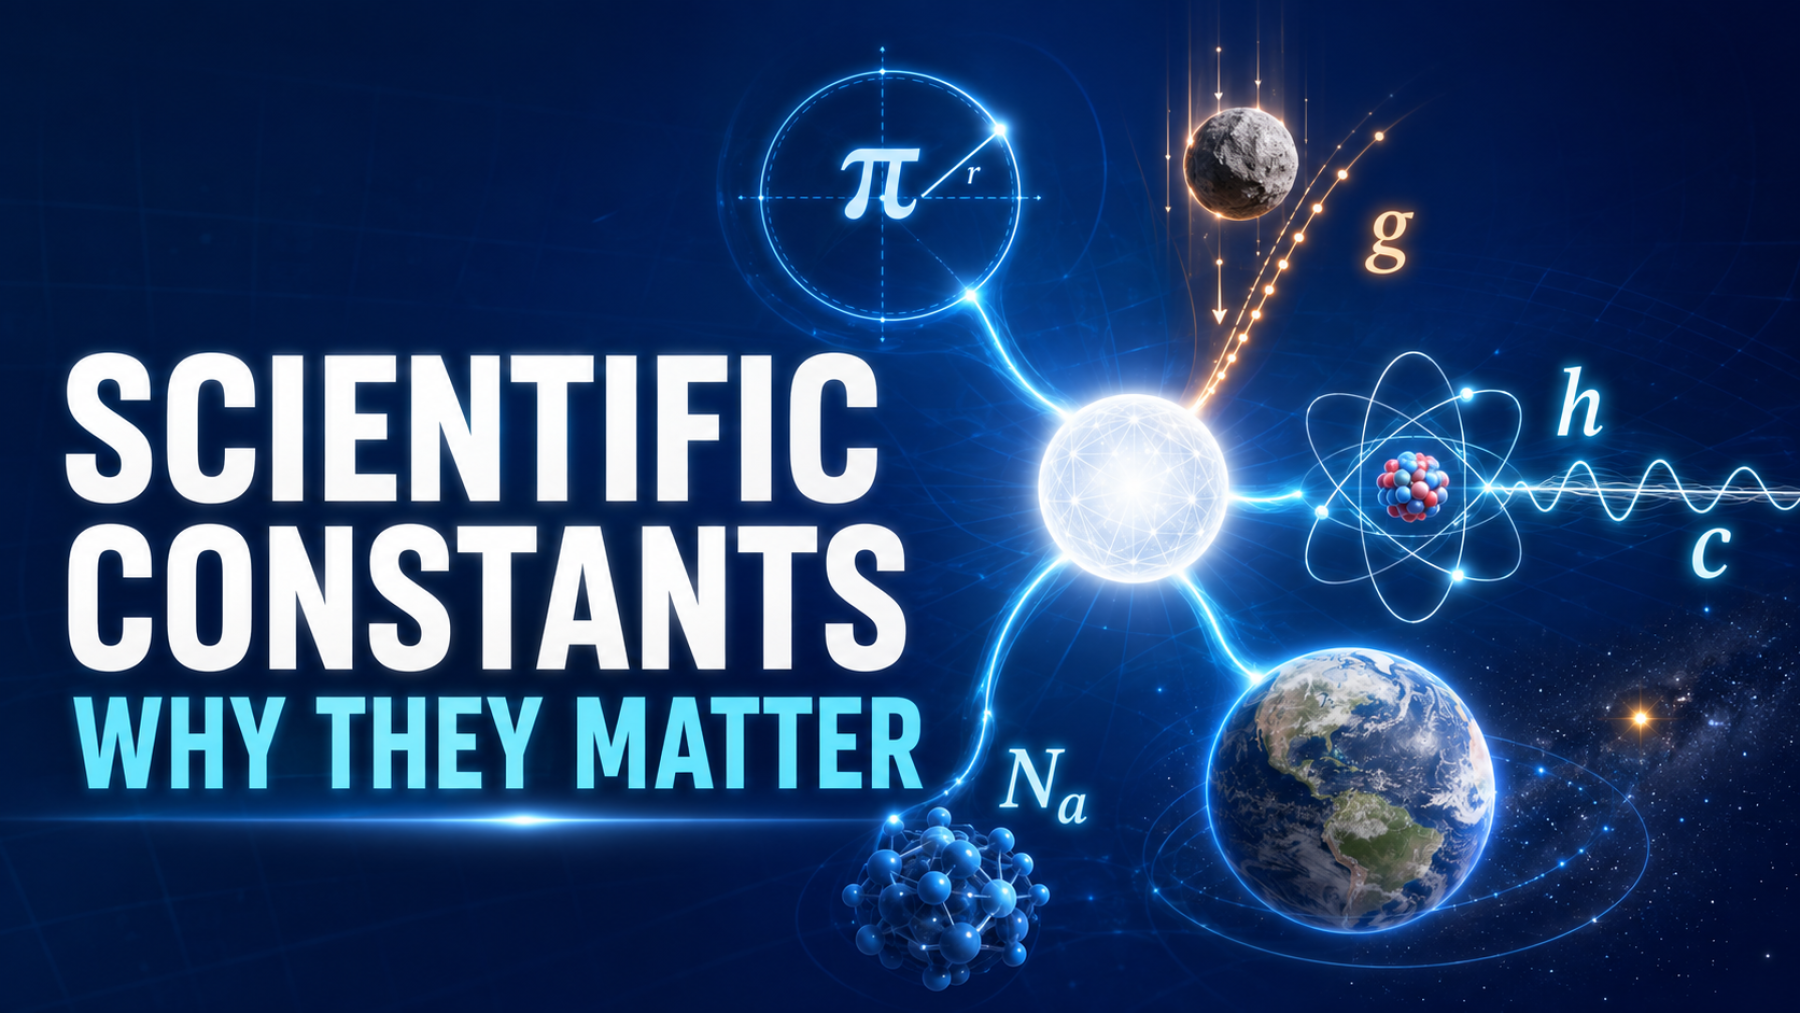
Scientific Constants: Why They Matter in Science
Discover why scientific constants matter, how they connect different areas of science and where familiar values are used in everyday life.
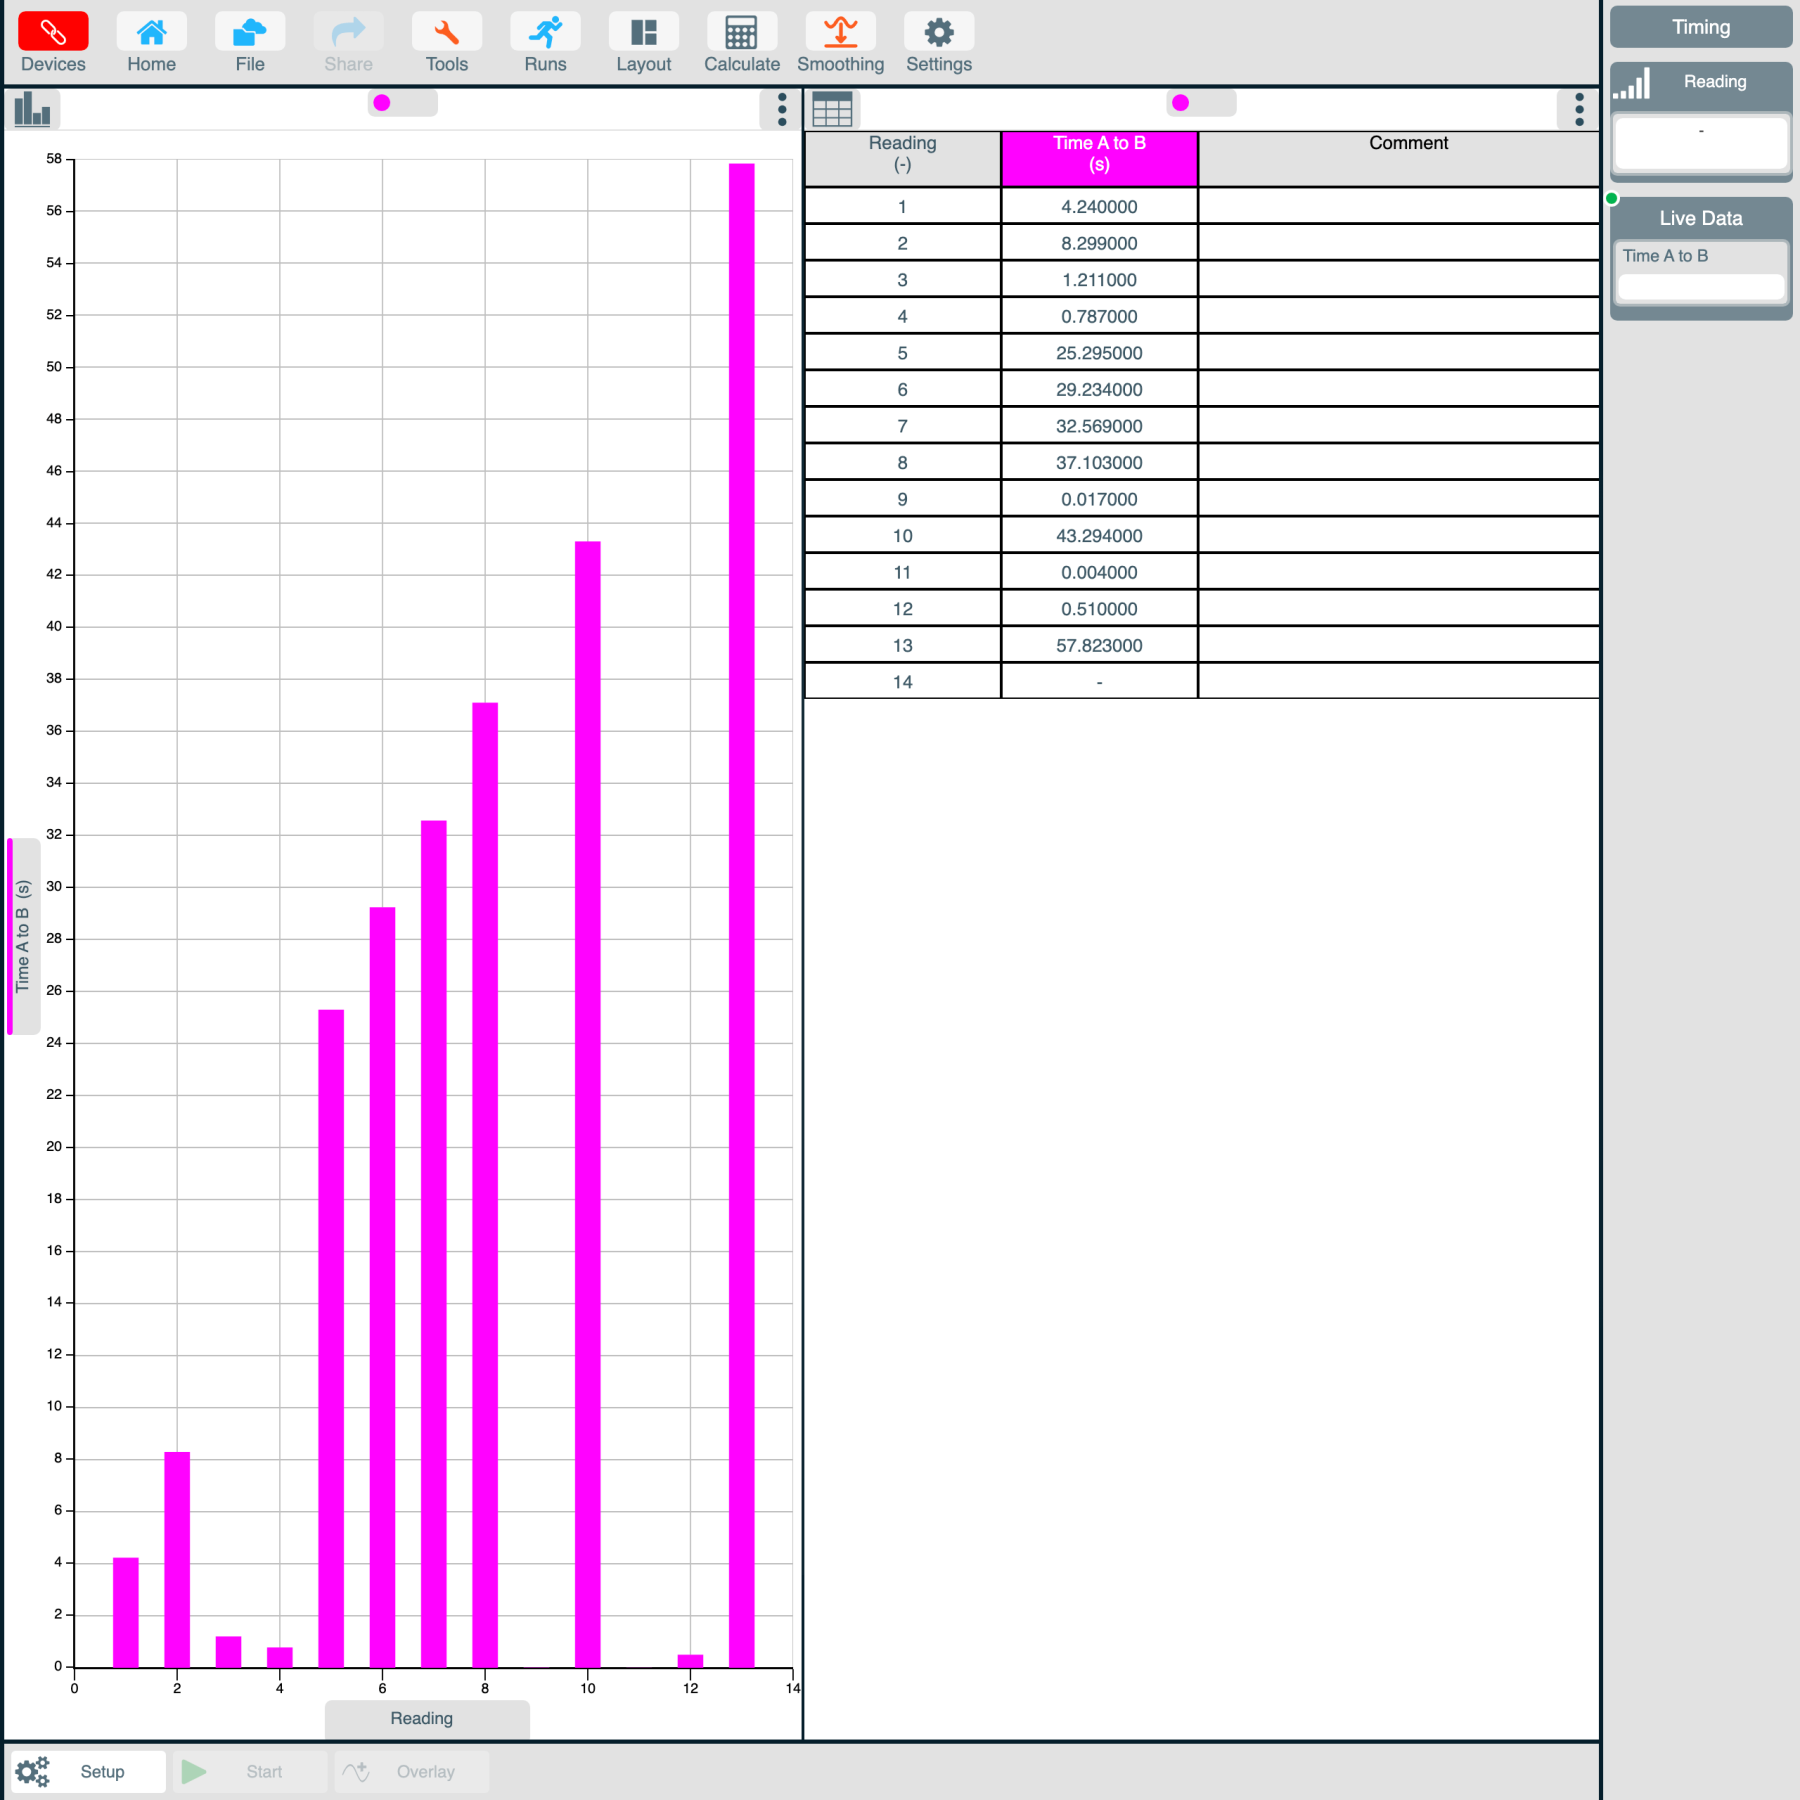
Terrific Reactions
A reaction time is the quickest time an individual can respond to a stimulus. A reaction time is the total time for a message travel up to the Central Nervous System [CNS] and come back again and produce a response.