Published: Aug-2026 | Category: Secondary Science
What makes a measurement trustworthy? It is tempting to think that more decimal places, a larger set of readings or a smoother graph must mean better science. In reality, reliable data begins much earlier: with a clear question, suitable equipment and a method designed to control the most important sources of error.
Measurement error does not automatically mean that somebody has made a mistake. Every practical measurement has limitations. The aim is to recognise those limitations, reduce their effect where possible and decide whether the evidence is strong enough to support a conclusion.
This topic helps students learn how to:
Before selecting a sensor or taking a reading, ask two questions: What am I trying to measure? and How accurately do I need to measure it?
The answers affect the equipment, measurement range, resolution, sensor position and method of data collection. A setup that works well for a large temperature change may not be suitable when the expected change is only a fraction of a degree.
This is why a high-resolution instrument cannot rescue a poorly designed investigation. It may display very small changes, but those changes will not be useful if the sensor is in the wrong place or the experiment does not answer the original question.
Useful checks include:
These terms describe different features of a measurement:
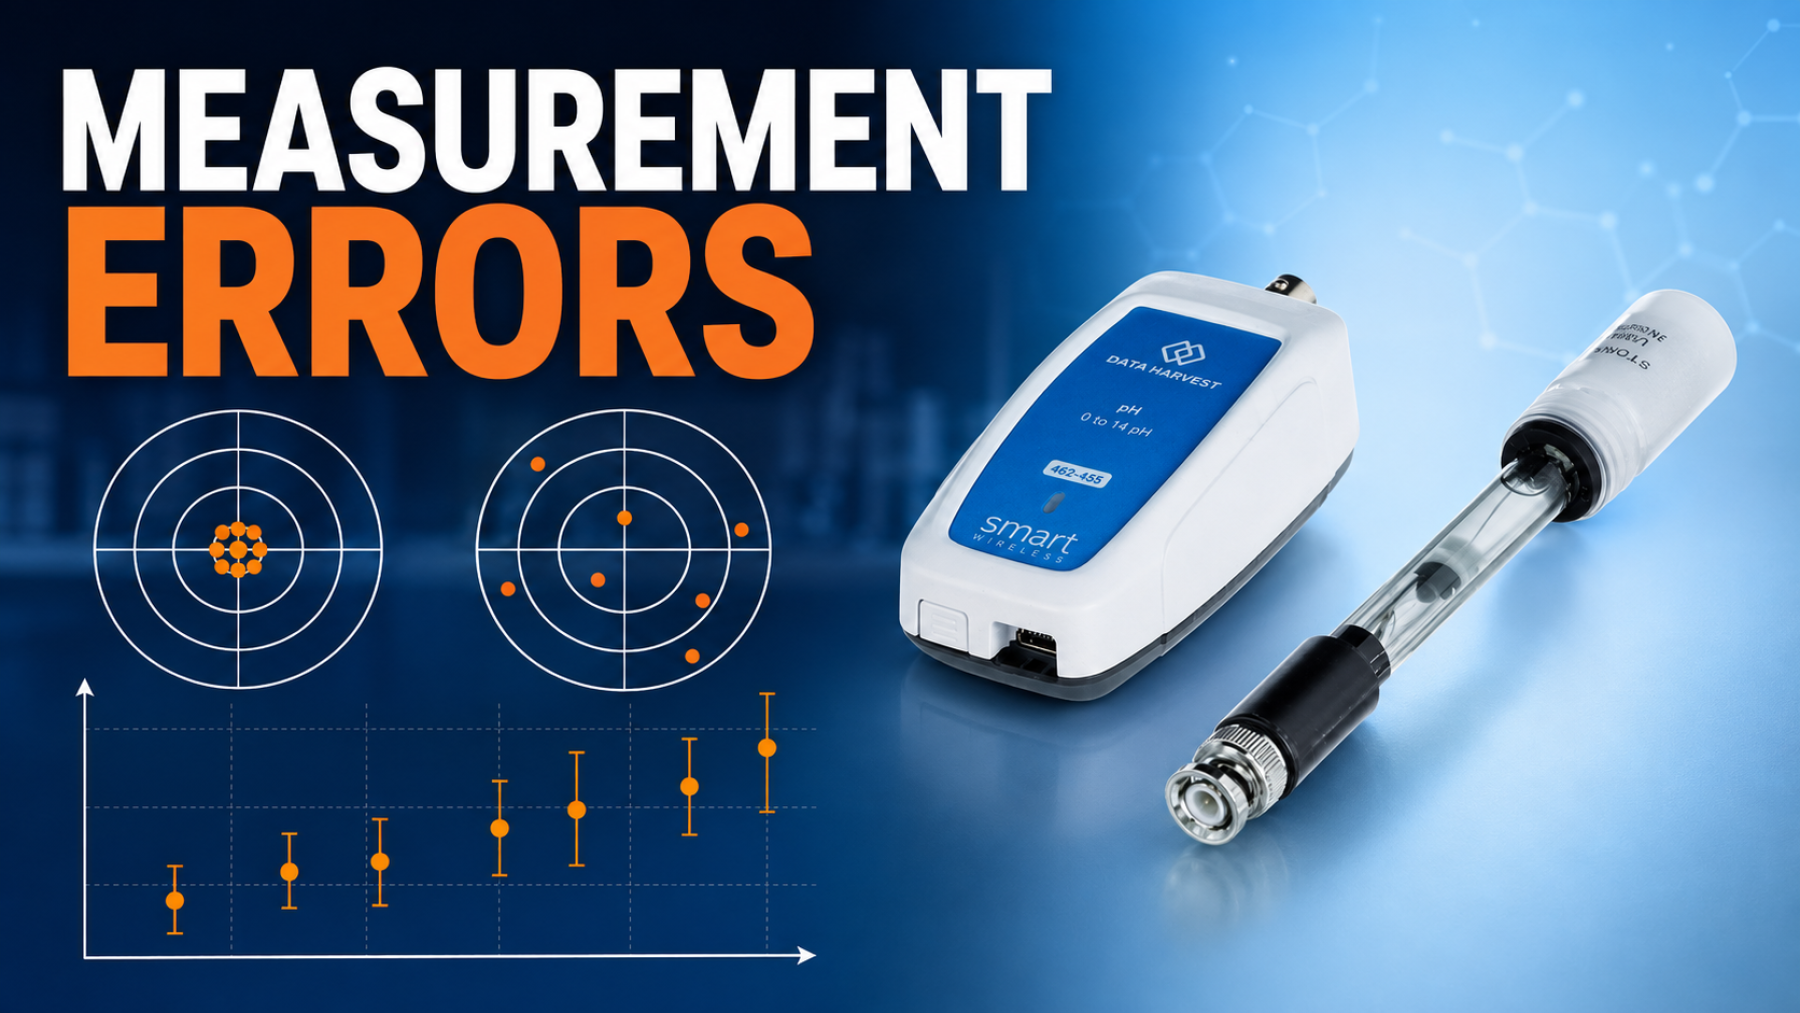
A set of readings may be close together but still be wrong if the instrument has a consistent bias. In that case the measurements are precise but not accurate. Equally, readings may be spread out around the true value: accurate overall, but not very precise.
Resolution also needs careful interpretation. A display with more decimal places does not necessarily provide a more accurate answer. Those digits are only useful when the instrument's accuracy, calibration and measurement method are good enough to support them.
Systematic error shifts measurements consistently in one direction. Possible causes include a zero error, poor calibration, incorrect setup, a consistent environmental effect or measuring in the wrong position.
Where possible, compare the equipment with a known reference and ask: is something causing all the readings to be too high or too low? Simply taking more measurements will not remove a systematic error.
Random error causes repeated measurements to vary unpredictably. Its effect can often be reduced or described by repeating measurements, keeping the procedure consistent, controlling environmental conditions and collecting enough good-quality data to calculate a mean and spread.
Before collecting data, students can work through this sequence:
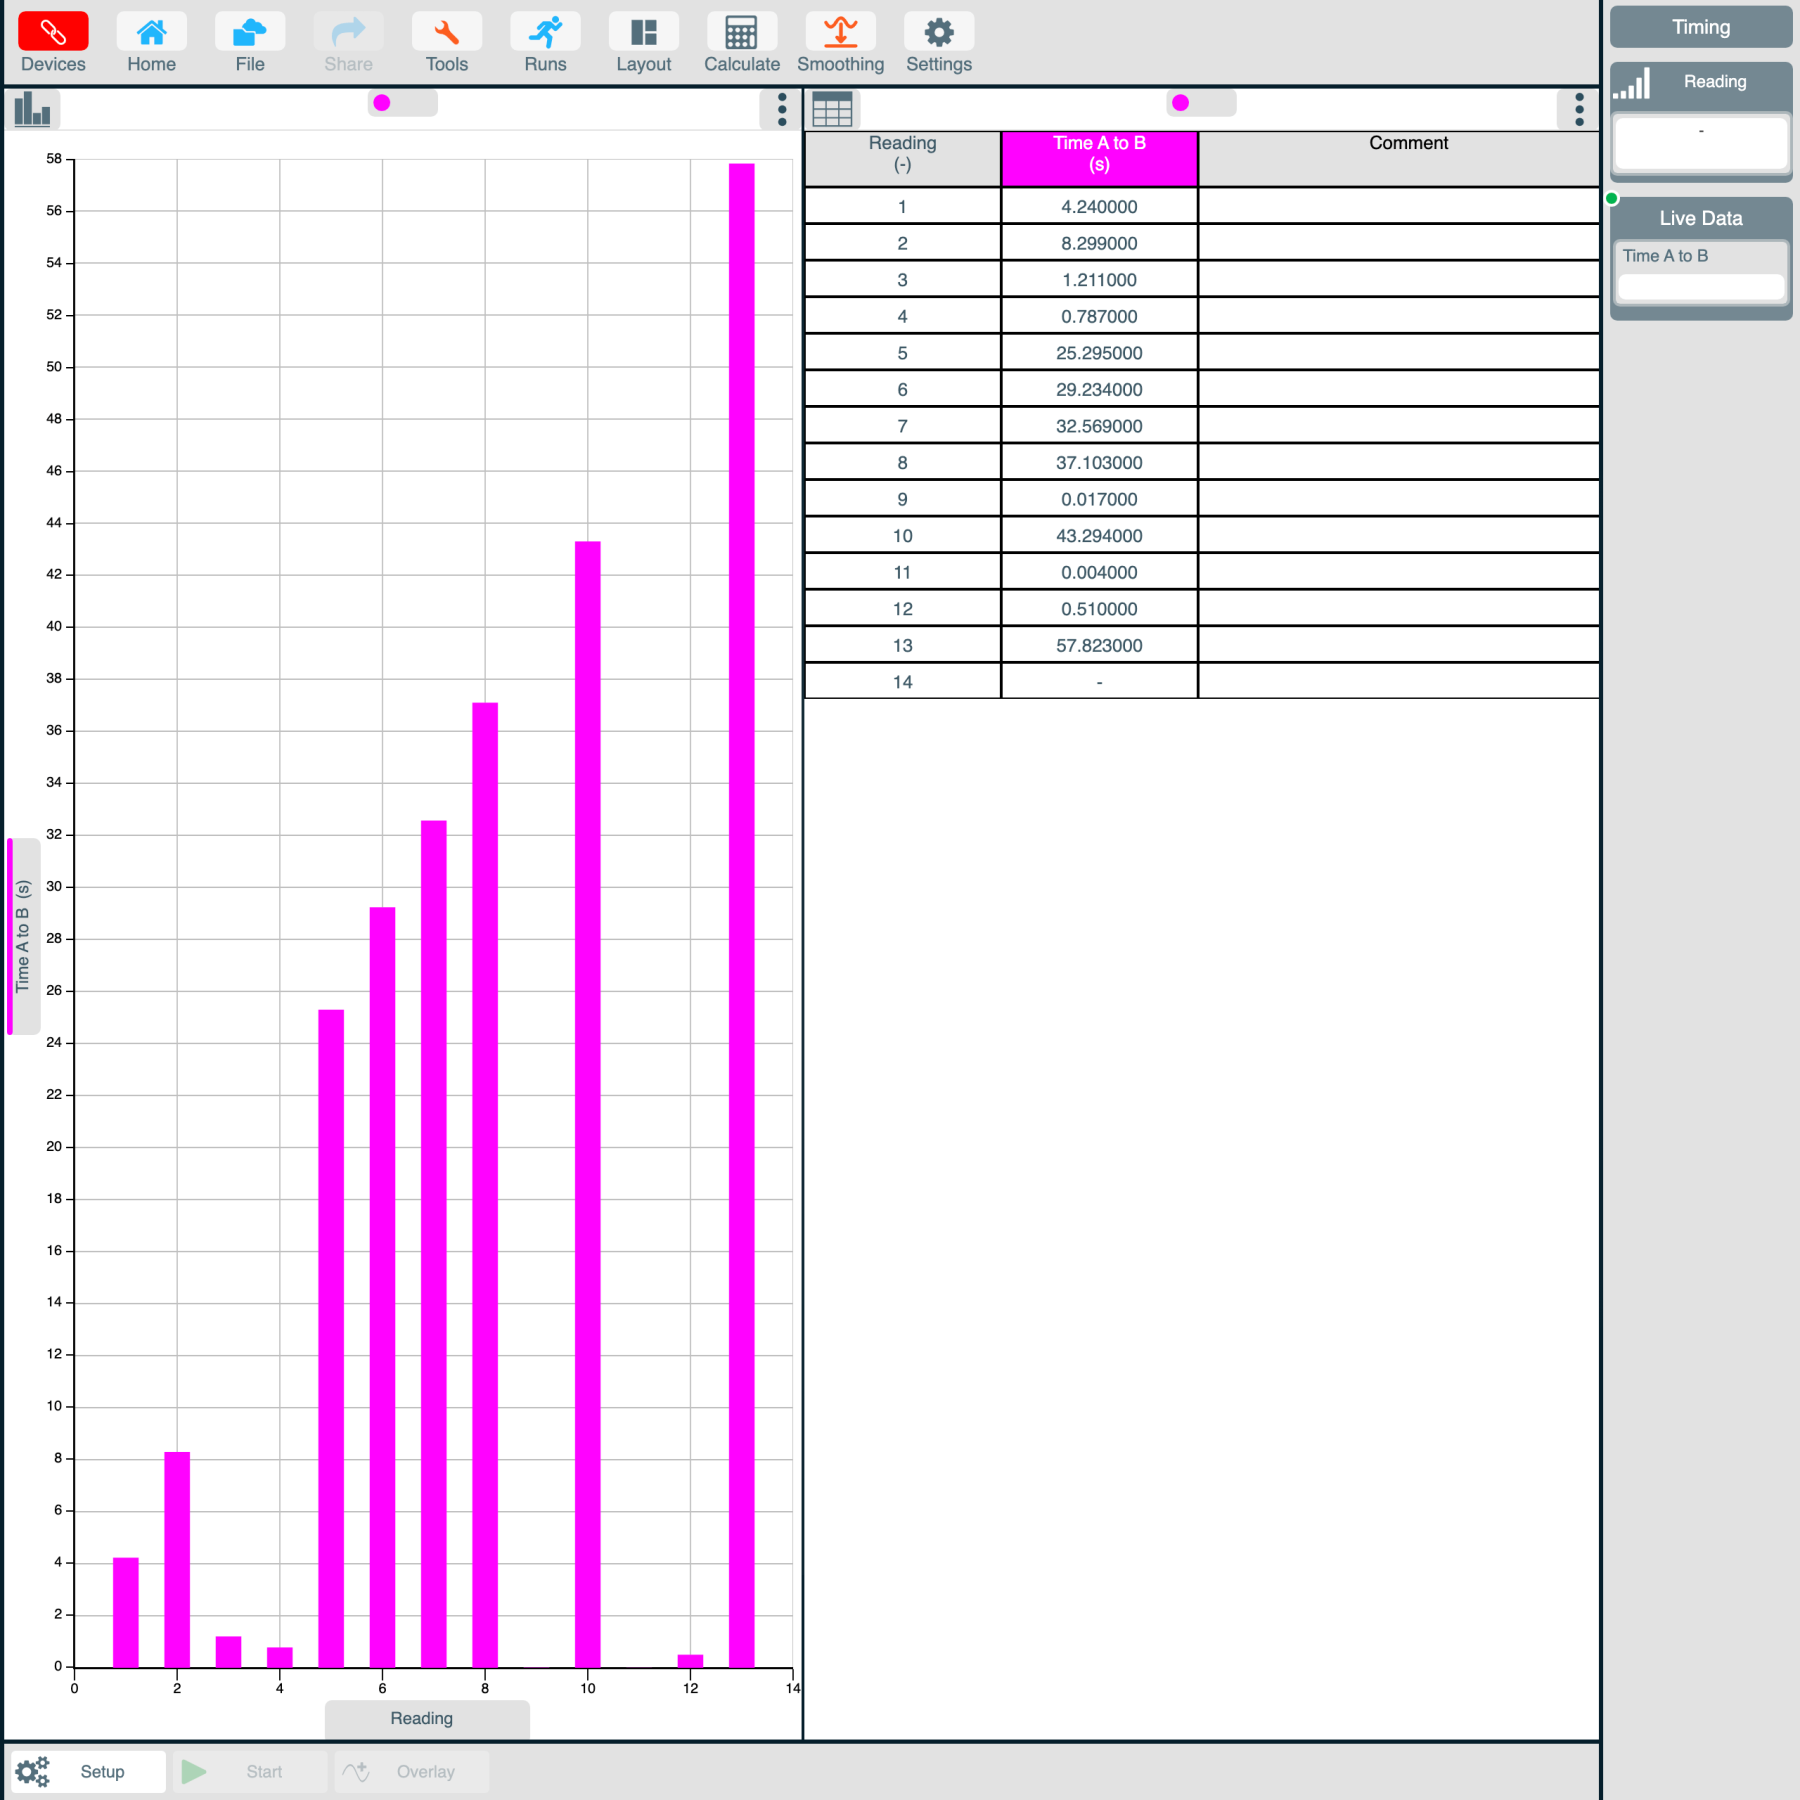
When collecting readings with EasySense, this thinking should happen before recording begins. Students can then examine the resulting data or graph and ask whether the pattern is likely to be real, whether the readings are repeatable and whether the setup may have introduced bias.
A single average cannot describe everything about a set of results. Several simple statistics help reveal both the typical value and the amount of variation.
The mean is the total of all the readings divided by the number of readings. It gives a typical value for the set:
Mean = sum of readings ÷ number of readings
The range is the difference between the largest and smallest values:
Range = maximum value − minimum value
It is a quick measure of overall spread, although it depends only on the two most extreme readings.
Standard deviation describes how spread out the measurements are around the mean. A small standard deviation means the readings tend to be close to the mean; a larger value indicates greater variation.
Standard error describes the precision of the estimated mean. It is calculated by dividing the standard deviation by the square root of the number of readings:
Standard error = standard deviation ÷ √number of readings
As the number of suitable measurements increases, the standard error will generally decrease. This can improve confidence in the estimated mean, but it still will not correct a systematic bias.
Suppose five temperature readings are 20.1, 20.4, 19.9, 20.2 and 20.4 °C.
The mean gives the typical measurement. The standard deviation describes the variation between the individual readings, while the standard error describes the precision of the estimated mean. Together, they provide a more useful account of the data than the mean alone.
When an investigation asks whether two variables are related, plot the measurements and look for a pattern. A line of best fit can summarise a linear relationship using:
y = mx + c
Here, m is the gradient and c is the intercept. The least-squares method finds the line that minimises the total squared difference between the measured points and the fitted line. The model can then help describe the relationship and, within sensible limits, make predictions.
The coefficient of determination, written as R2, indicates how closely the data fits the model. An R2 value close to 1 indicates a stronger fit, while a value close to 0 indicates a weak fit. For example, R2 = 0.90 means that the model accounts for 90% of the variation in the response variable.
A strong fit does not by itself prove that one variable causes the other. Students should still consider the method, possible errors, the range of data collected and whether a different model may be more suitable.
Good measurement is a complete chain: question, equipment, calibration, range, resolution, accuracy, placement, conditions, sampling, repeatability, statistics and conclusion. A weakness at any stage can limit the quality of the final evidence.
Reducing error is not about always choosing the most sophisticated equipment. It is about selecting an appropriate method, controlling the important variables, collecting enough good-quality measurements and using statistics to understand what the data is showing.
The full worksheet includes an equipment checklist, explanations of systematic and random error, statistical formulae, a worked temperature example and guidance on lines of best fit.
Take a look at the following articles from the same topic.