Published: Aug-2026 | Category: Secondary Science
Why can two groups carry out the same practical and produce noticeably different results? The answer is not always that one group has made a mistake. The difference may come from the sensor they selected, where it was placed, how often readings were collected or how the data was analysed.
Reliable data begins long before a graph appears on screen. It starts with a clear question and continues through every decision in the measurement process. By understanding that complete chain, students can collect more useful evidence and draw stronger conclusions.
This activity helps students to:
Before choosing a sensor or setting up the data logger, ask: What am I trying to find out?
A well-defined question helps determine what should be measured, the likely range of values, where the sensor should be positioned and how frequently readings need to be collected. If the question is vague, even a large collection of accurate readings may not provide a useful answer.
Four specifications are particularly useful when deciding whether a sensor is suitable:
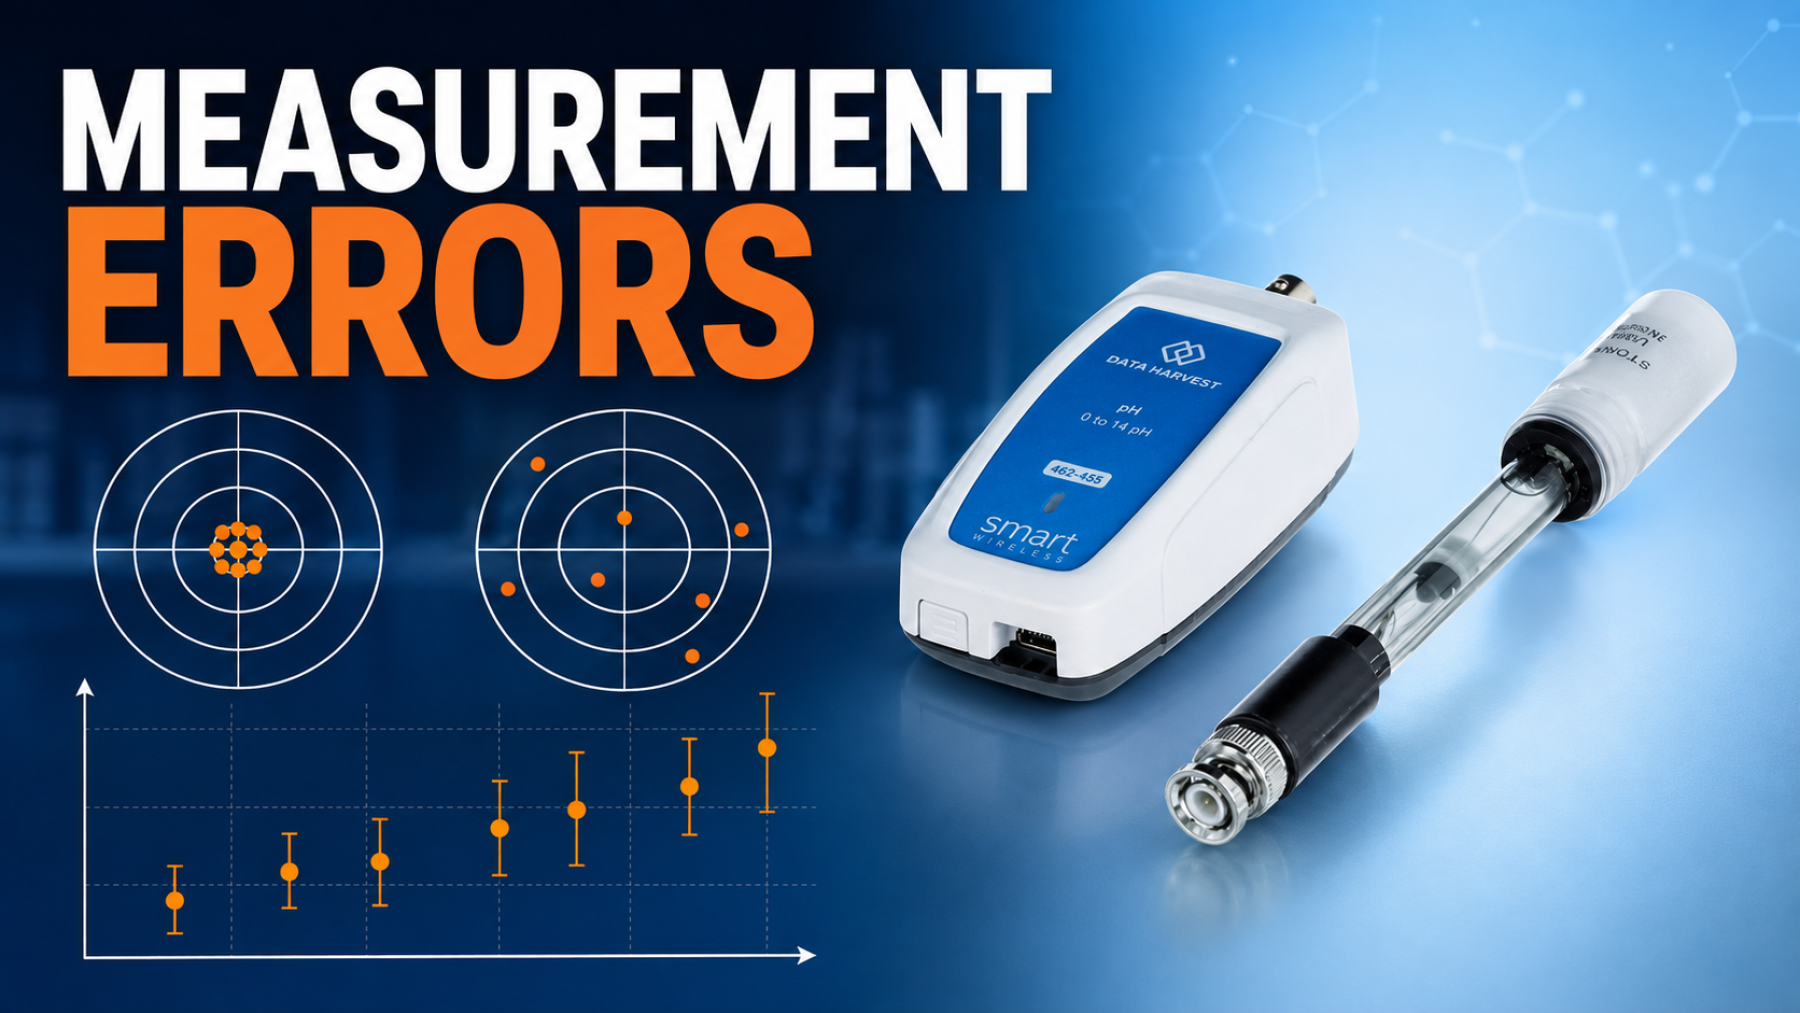
These terms describe different qualities. More decimal places do not automatically mean that a result is more accurate, while the widest available range is not necessarily the best choice. The aim is to match the sensor and range to the size of the changes being investigated.
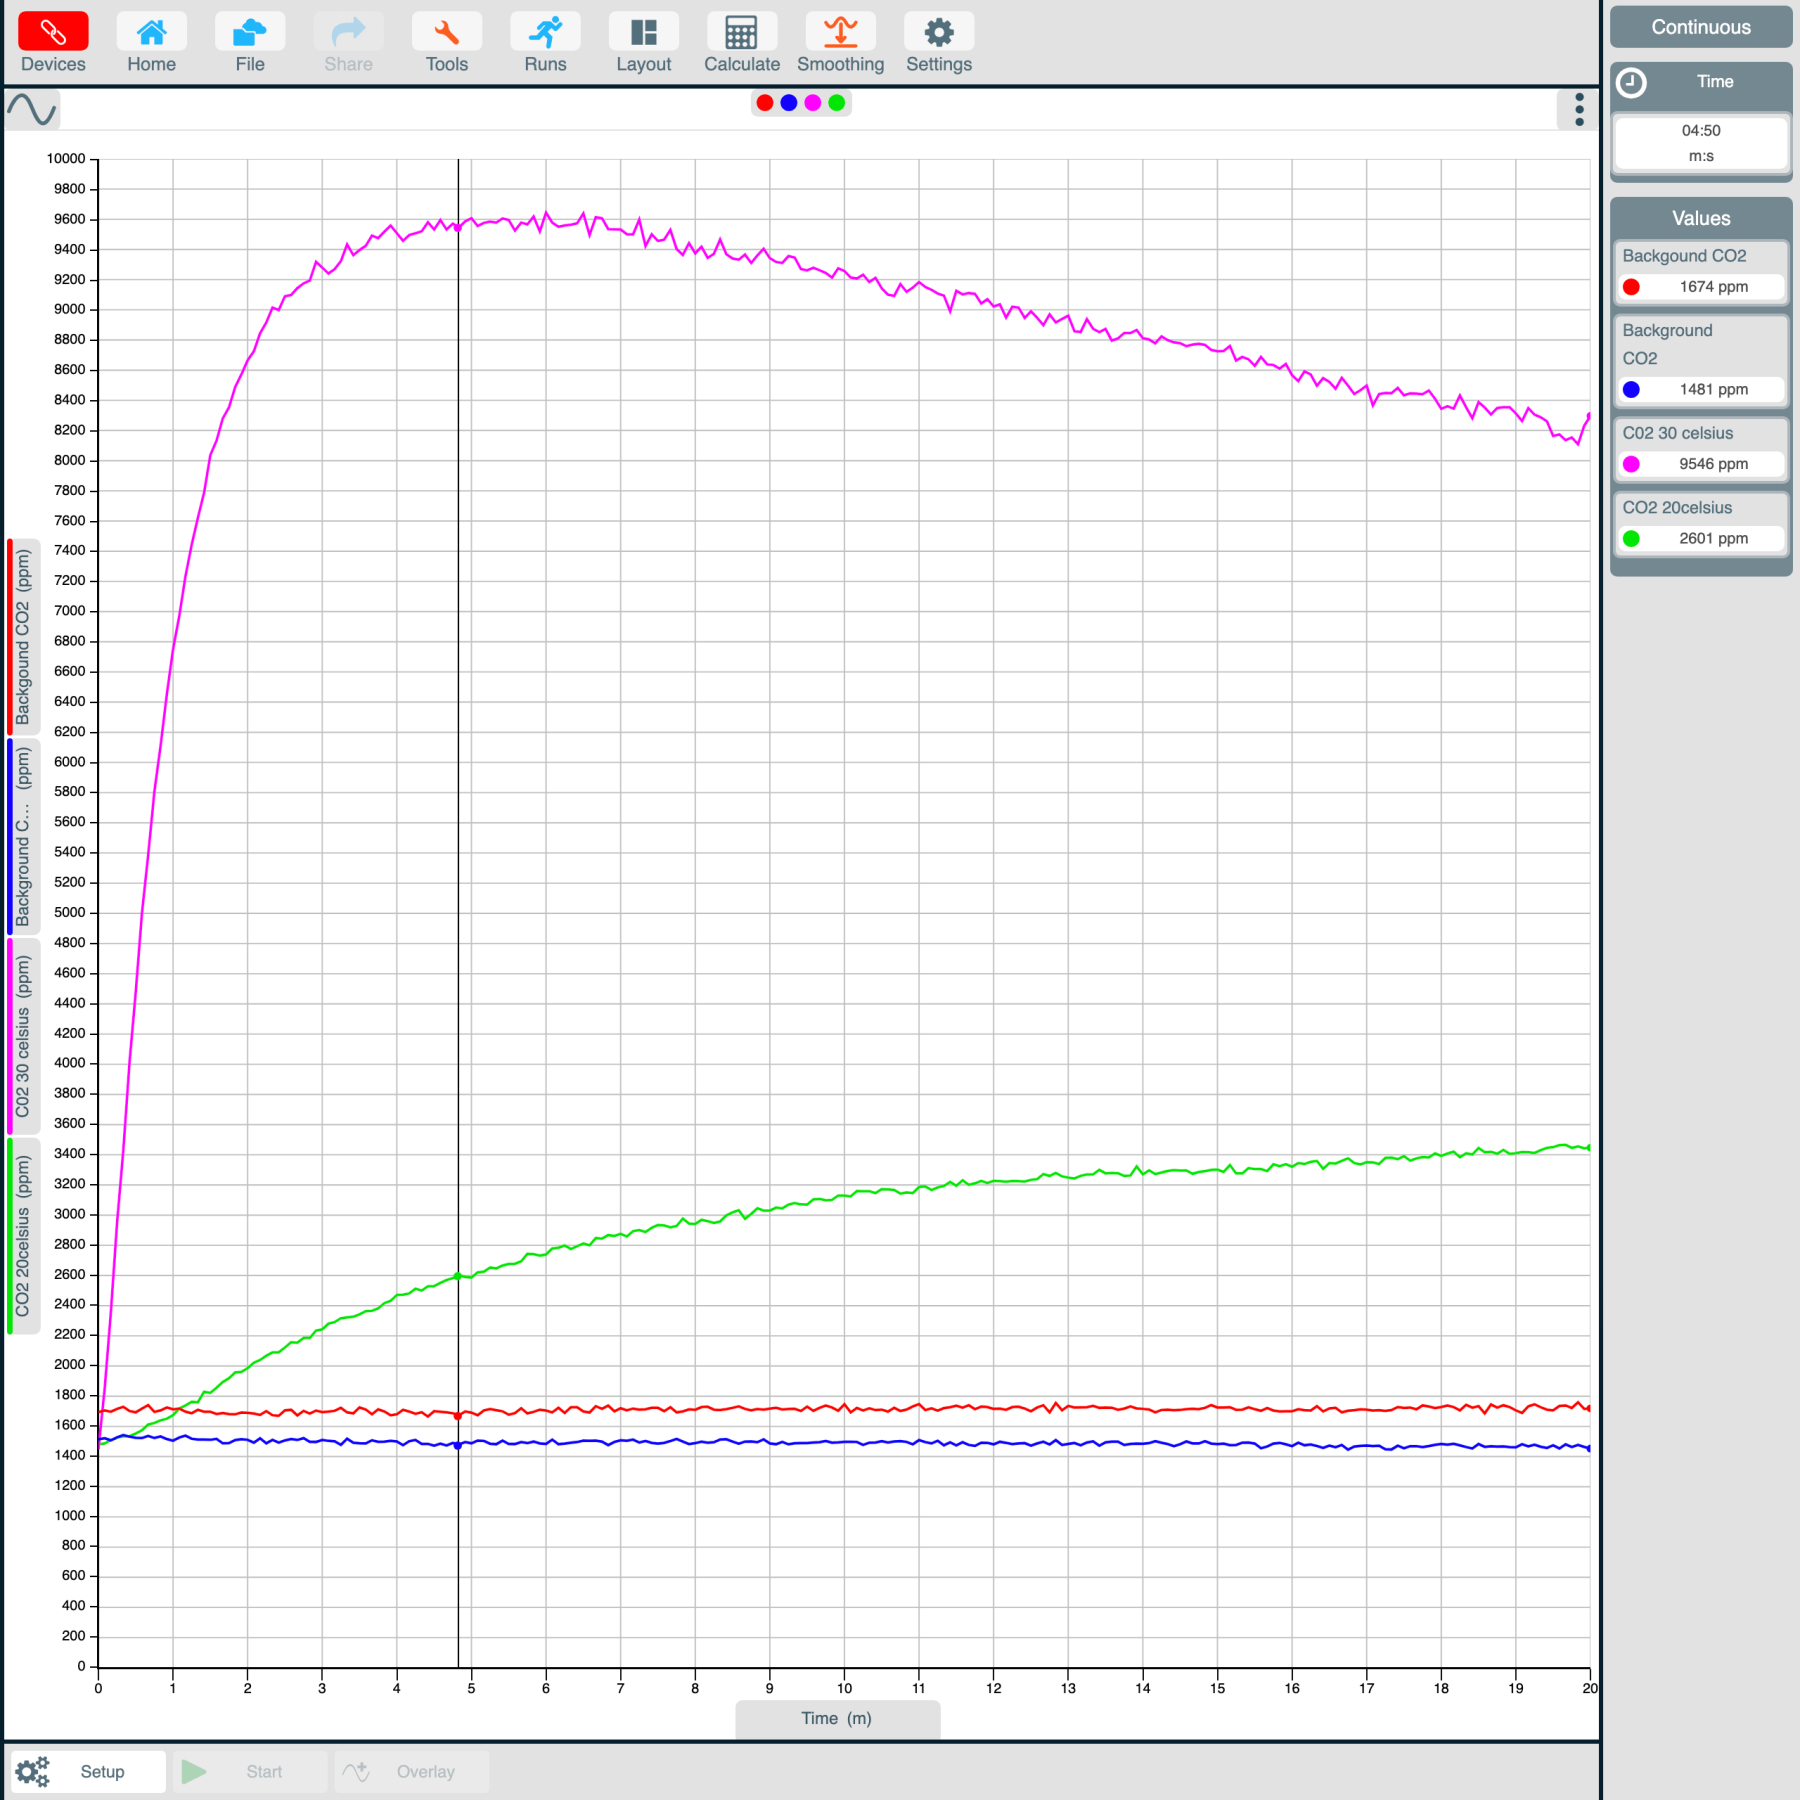
A suitable sensor can still produce poor data when it is positioned incorrectly. Depending on the investigation, students may need to consider depth, contact, movement, direct sunlight or other environmental effects. A useful check is: Is the sensor measuring the quantity I think it is measuring?
Response time is important too. Sensors do not always respond immediately when conditions change. If the response is slower than the process being studied, a peak may appear lower, later or broader than expected.
The sampling rate determines how frequently measurements are recorded. A rapidly changing event normally needs faster sampling, while a slow process can be followed using longer intervals.
Collect enough measurements to describe the process and support the intended analysis. More readings can improve estimates of the mean and variation, but collecting the largest possible data set is not the goal. The readings must also be relevant and of good quality.
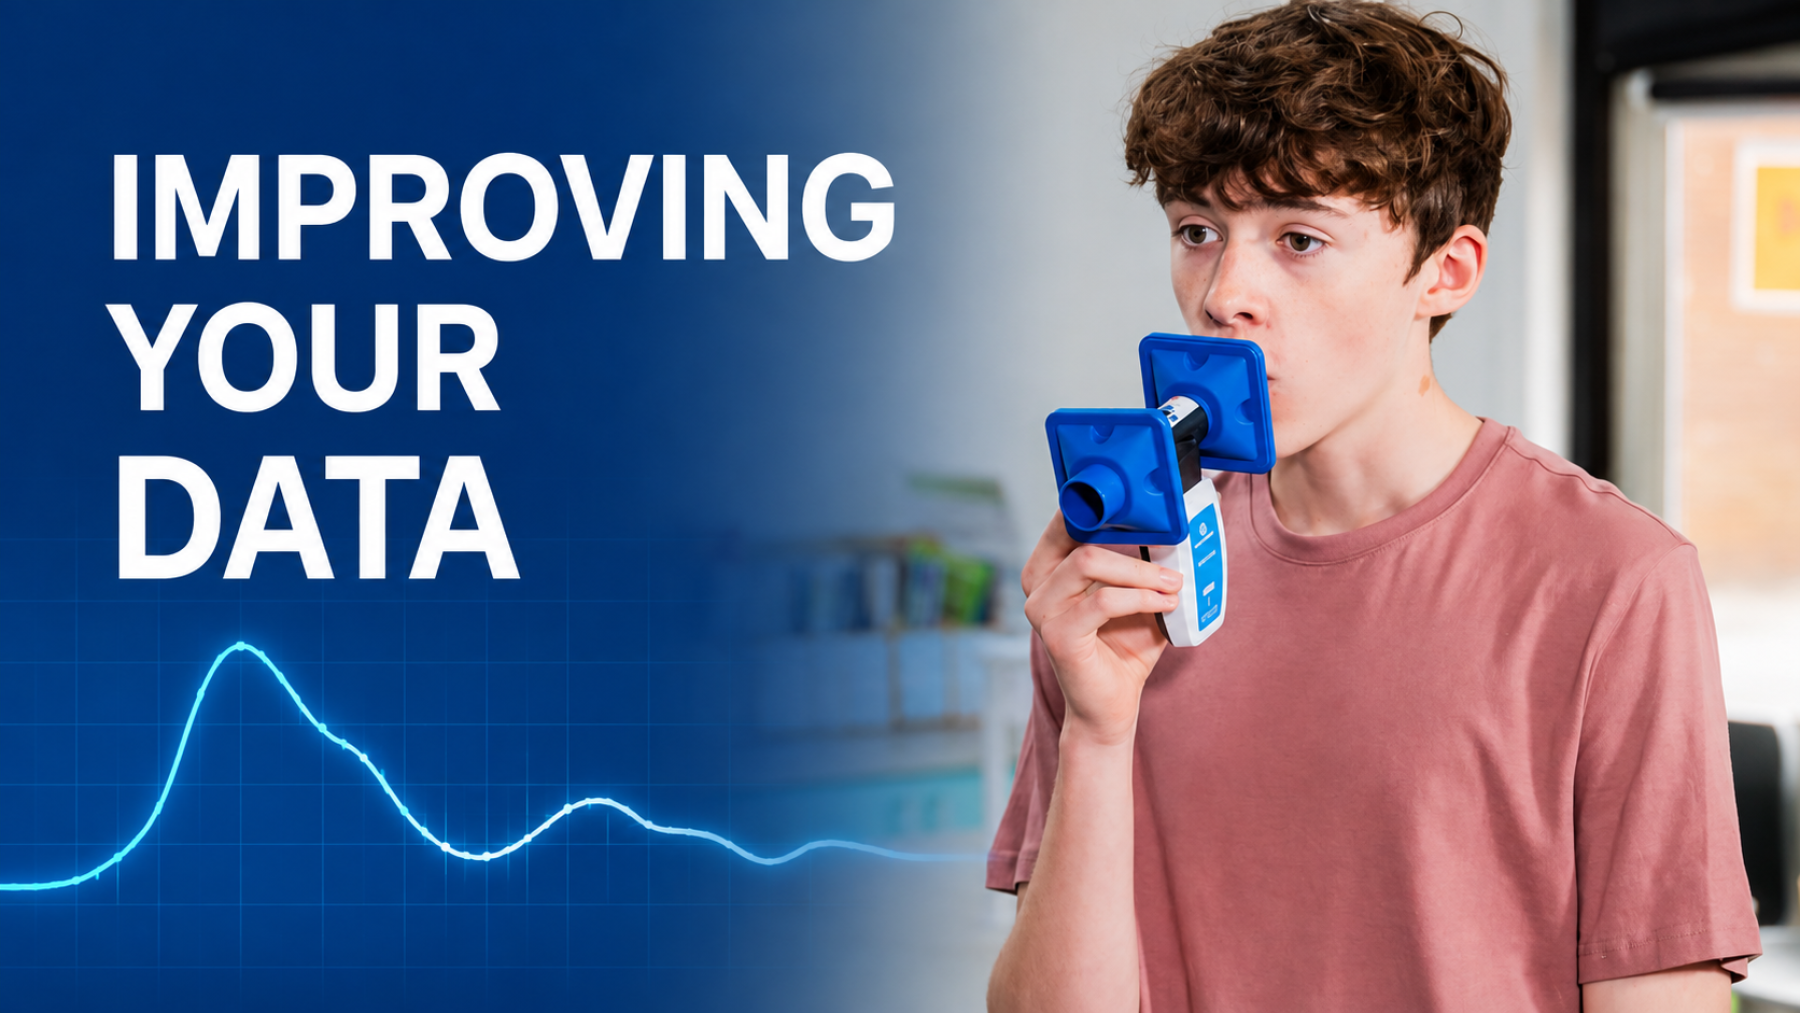
Breathing provides a clear example because airflow and volume change continuously. The Data Harvest Wireless Spirometer Sensor can display live breathing data in EasySense, allowing students to examine features such as breathing patterns, tidal volume, flow-volume curves and breathing before and after exercise.
The investigation question should guide the setup. A study of breathing rate may require a different time scale and interpretation from an investigation of peak flow. Consistent technique, suitable sampling and correct use of the flow head are all part of producing comparable results.
For breathing investigations, follow the product instructions and your school or college risk assessment. Fit a pressure filter and use one filter for each person being tested.
Once the measurements have been collected, statistics can summarise what is typical, how much the results vary and how precisely the mean has been estimated.
For example, five temperature readings of 20.1, 20.4, 19.9, 20.2 and 20.4 °C have a mean of 20.2 °C and a statistical range of 0.5 °C. Their standard deviation is approximately 0.21 °C and the standard error is approximately 0.09 °C. Each value describes a different feature of the same data set.
As the number of useful measurements increases, the standard error will generally decrease. This is one reason why a sufficiently large, well-collected data set can give a more precise estimate.
Summary values cannot show everything. In EasySense, students can use graphs to look for:
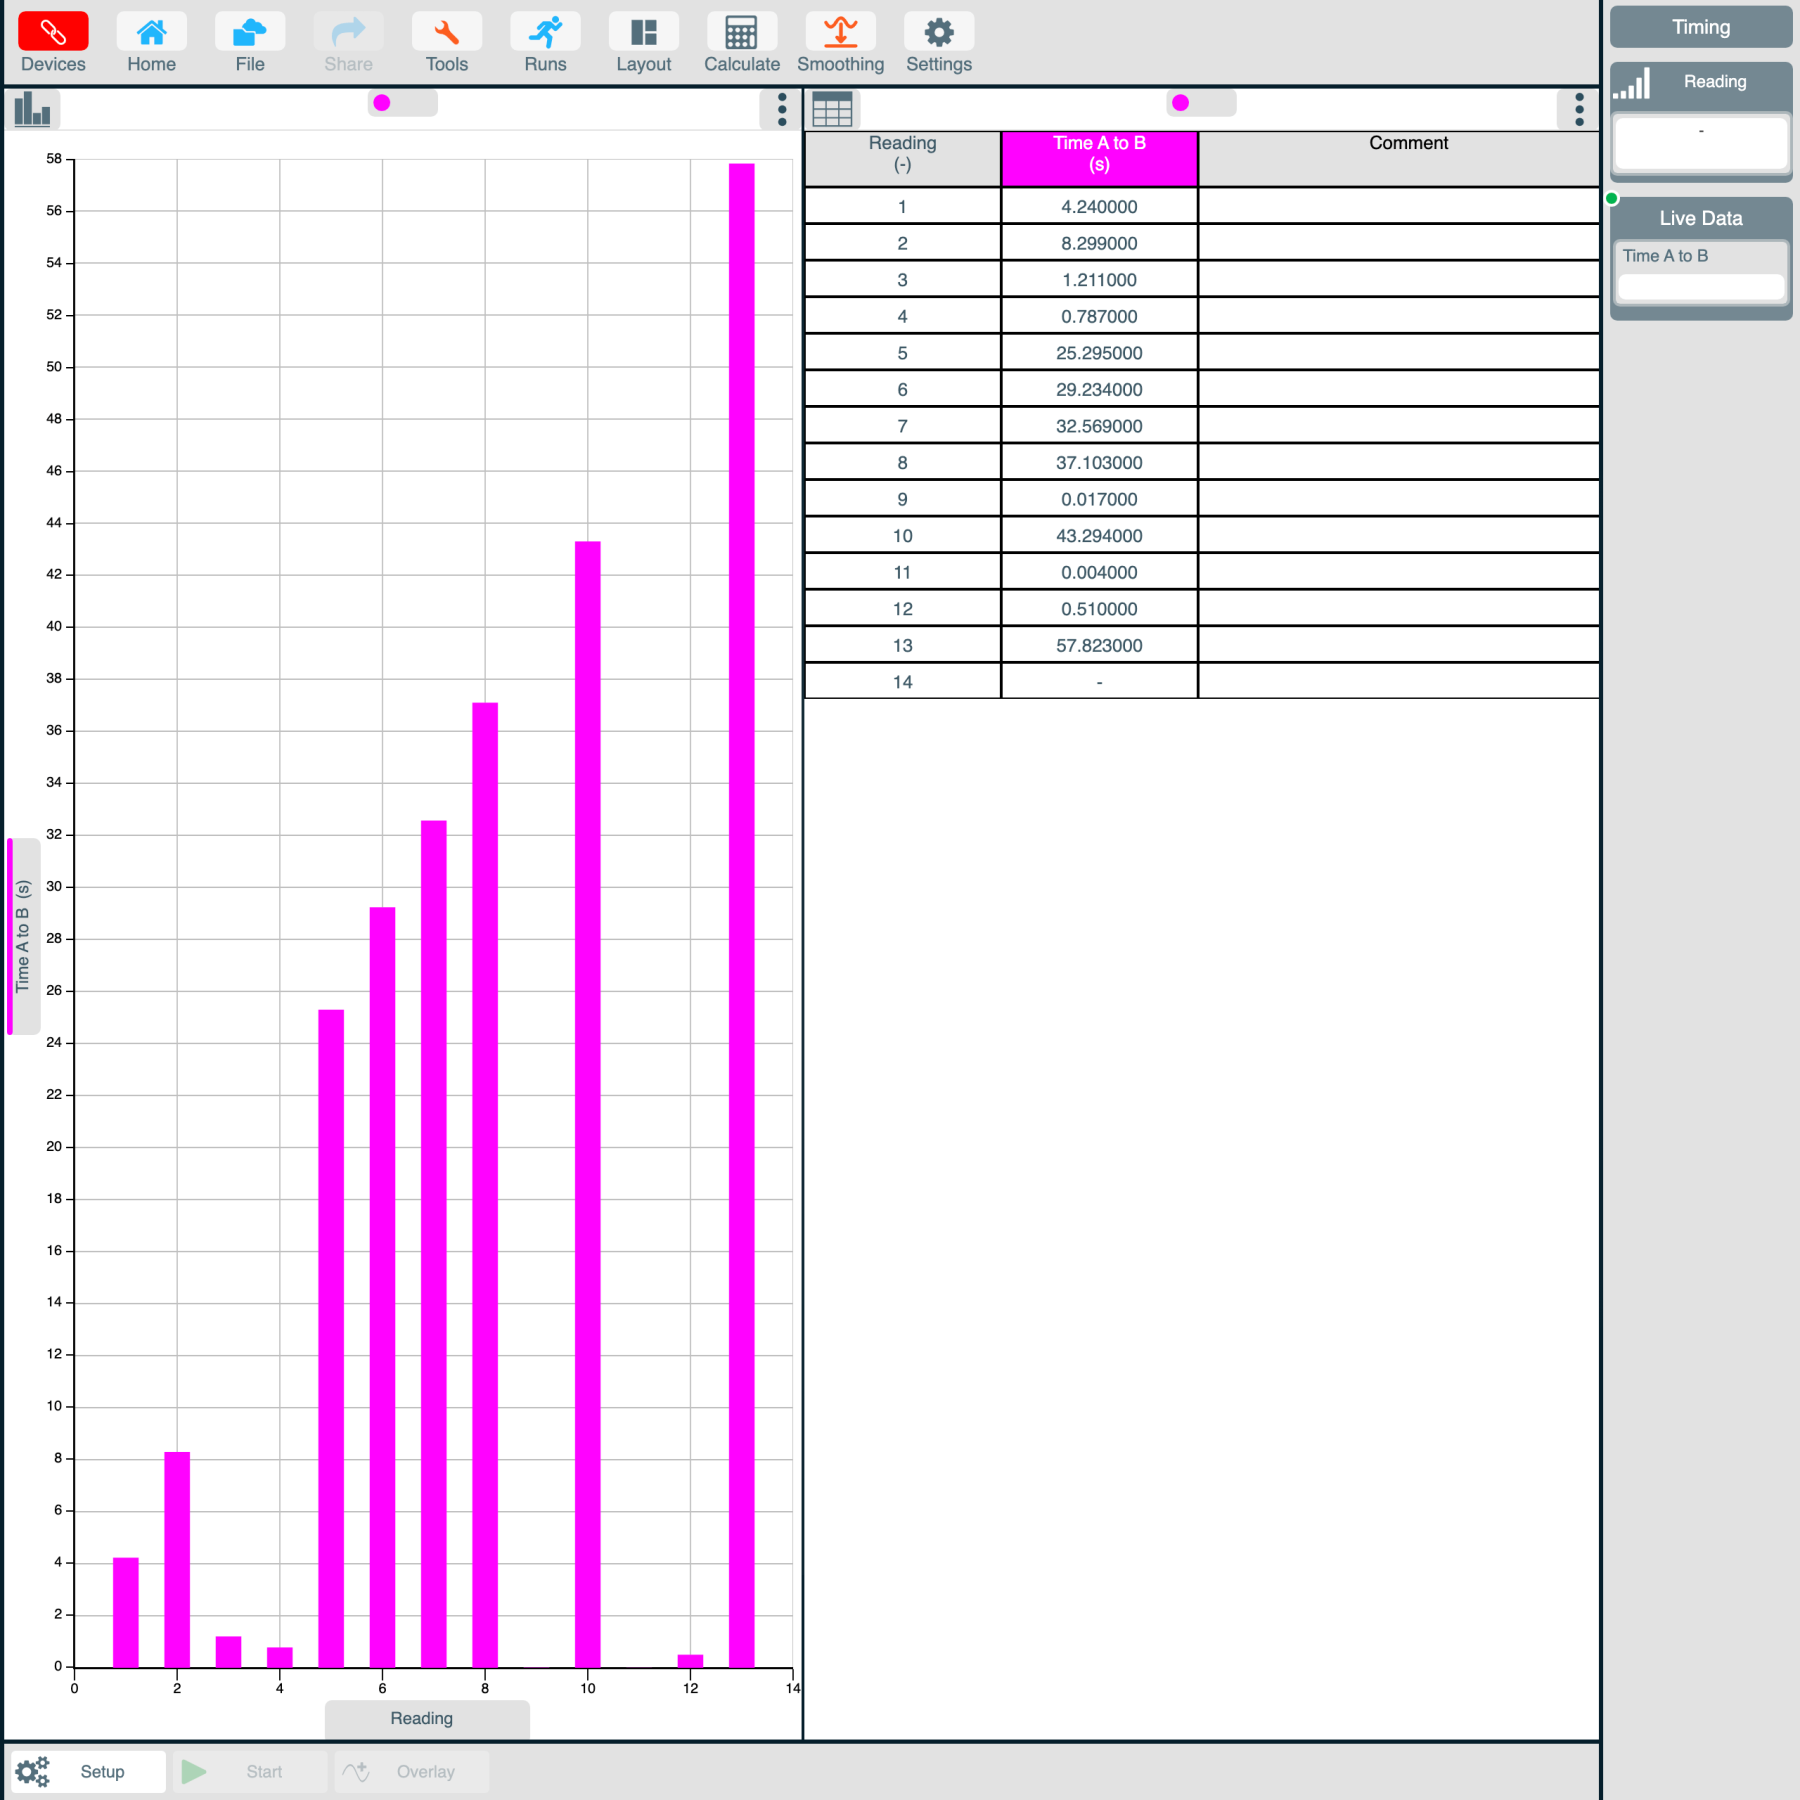
An unusual reading is not automatically bad data. It may reveal a genuine event, a change in technique or a problem with the setup. Students should investigate it before deciding whether it should be included, repeated or treated as an anomaly.
When two variables may be related, a line of best fit can help describe the relationship. The value of R2 indicates how closely the data fits the chosen model. For example, an R2 value of 0.90 means that the model accounts for about 90% of the variation in the response variable.
A high R2 value does not prove that one variable caused the other to change. Students should still consider the science, the experimental design and other variables that may have influenced the result.
Good data depends on the whole process:
Question → Sensor → Range → Resolution → Accuracy → Placement → Response → Sampling → Repeatability → Statistics → Conclusion
A high-resolution sensor cannot compensate for poor placement. An accurate sensor cannot answer the wrong question. Thousands of readings cannot rescue a weak measurement strategy. When each part of the chain is considered carefully, however, students can build a much stronger understanding of variation and relationships.
Getting the best from data logging is not about choosing the most sophisticated sensor or producing the biggest data set. It is about selecting the right measurement for the question, collecting enough good-quality evidence and using graphs and statistics to understand what the results are showing. The sensor is the beginning; the real value is in the data.
The full Improving the Data worksheet provides a concise guide to sensor choice, sampling, statistics and the complete measurement chain, including a worked example.
Take a look at the following articles from the same topic.