Published: Aug-2026 | Category: Secondary Science
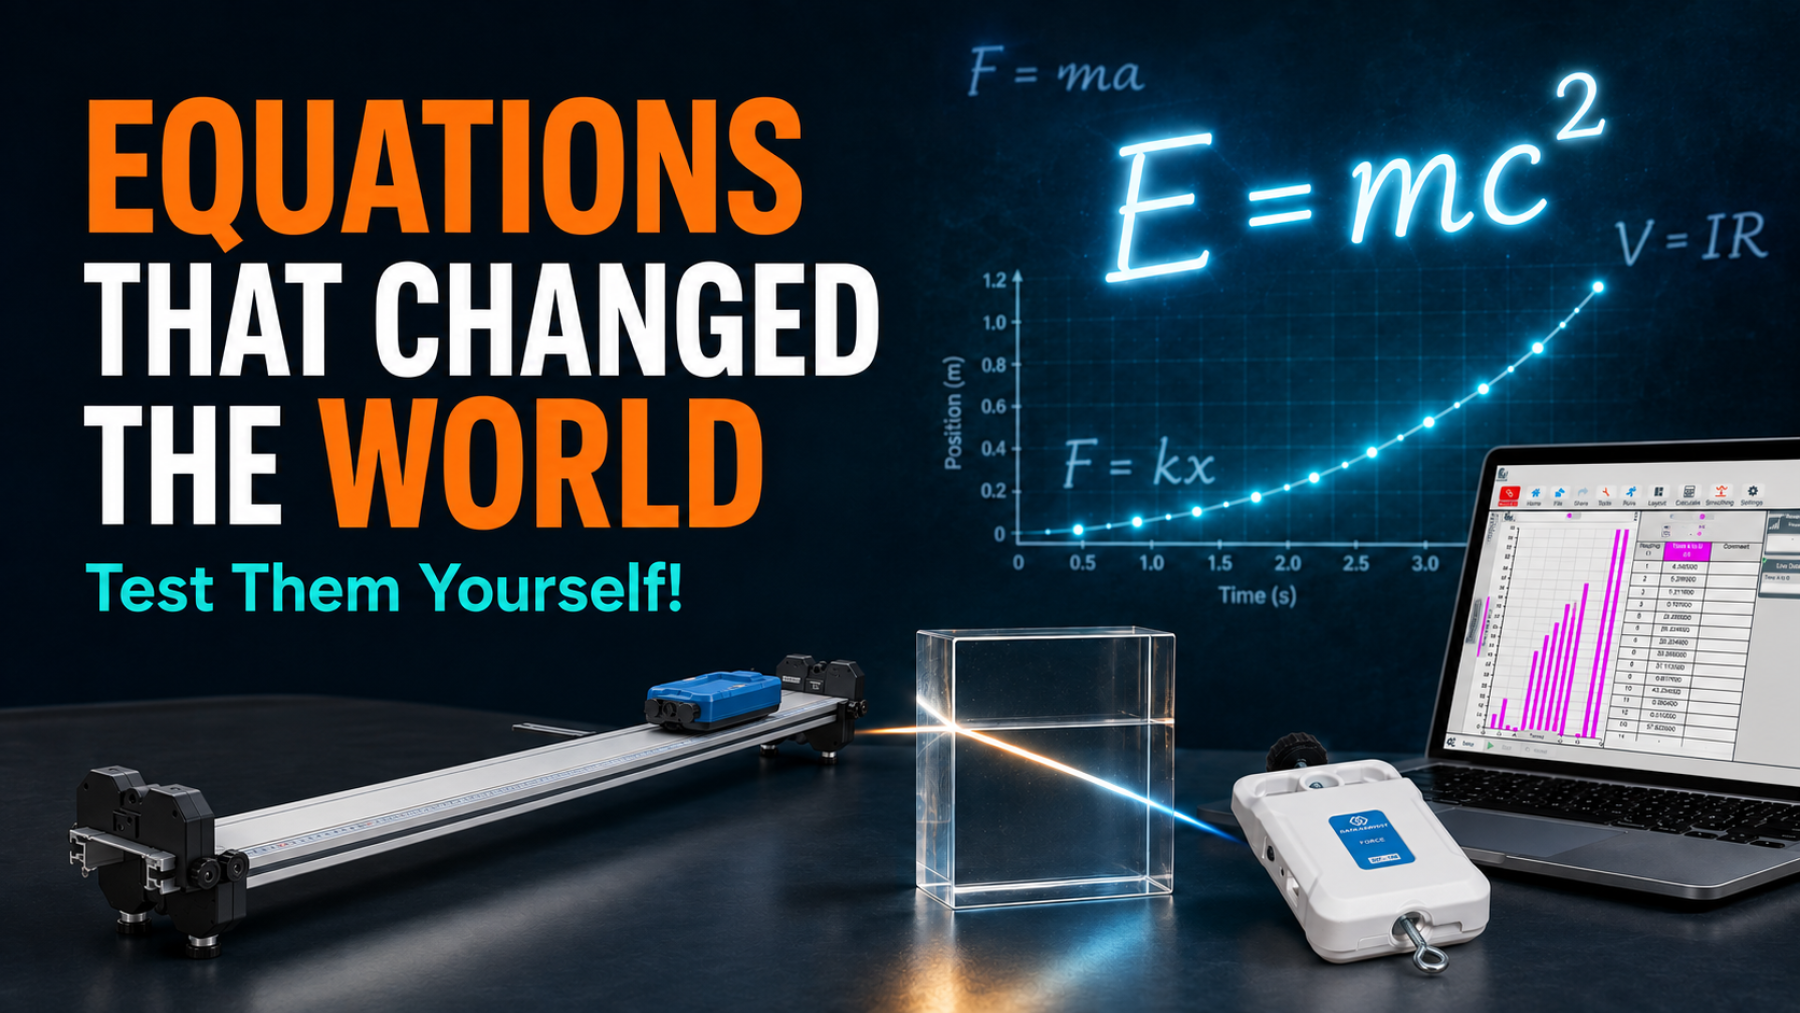
What is the world’s most famous scientific equation? For many people, the answer is simple:
E = mc2
Einstein’s equation transformed our understanding of the Universe. It helps explain how stars produce energy, why nuclear power works and how the atoms in our bodies were created billions of years ago.
But how many of us have ever tested it?
Unless you have access to a particle accelerator or nuclear physics laboratory, the answer is probably never. Fortunately, many other equations that changed science can be explored in a school laboratory using equipment such as trolleys, springs, electrical circuits and data-logging sensors.
The same principles used to describe moving vehicles, electrical devices, sound waves, gases and light can all be investigated through practical experiments.
That is where science becomes genuinely exciting. It is not simply about memorising equations; it is about discovering what they mean and seeing the relationships for yourself.
An equation is a compact way of describing a relationship between different quantities. It might show how the acceleration of an object depends on force, how the current in a circuit changes with voltage, or how pressure affects the volume of a gas.
Practical investigations allow students to change one quantity, measure another and decide whether the results support the predicted relationship.
Modern data logging makes these investigations even more powerful. Instead of relying entirely on rulers, stopwatches and individual manual readings, sensors can collect measurements many times every second. This provides more detailed results, clearer graphs and more opportunities to analyse what is happening.
Here are ten important scientific equations that students can investigate for themselves.
F = ma describes the relationship between force, mass and acceleration. It tells us that the acceleration of an object increases when a greater resultant force is applied. It also tells us that an object with a greater mass requires more force to produce the same acceleration.
This principle is essential to understanding everything from moving vehicles and sports performance to rockets and planetary motion.
A dynamics trolley can be pulled along a track using a falling mass or another controlled force. Students can investigate what happens when they:
A motion, acceleration or light gate sensor can measure the trolley’s movement. A force sensor can also record the applied force. Plotting force against acceleration should produce an approximately straight-line relationship when the mass remains constant.
F = kx describes how the extension of a spring relates to the force applied to it. In the equation, k is the spring constant and x is the extension.
Within its limit of proportionality, doubling the force applied to a spring should double its extension. This predictable behaviour makes springs useful in measuring instruments, vehicle suspension systems and many mechanical devices.
Students can suspend a spring and gradually add known masses. The force can be calculated from the weight of each mass, while the resulting extension is measured.
A force sensor and position sensor can collect both measurements directly. Plotting force against extension should produce a straight line while the spring obeys Hooke’s Law. The gradient of the graph gives the spring constant.
Students can also investigate what happens when the elastic limit is exceeded and determine whether the spring returns to its original length.
Momentum is calculated using p = mv, where m is mass and v is velocity. A heavy object travelling slowly can have the same momentum as a lighter object travelling quickly.
Momentum is particularly important when studying collisions. In a closed system, the total momentum before a collision should equal the total momentum afterwards.
Two dynamics trolleys can be used to investigate collisions. The trolleys might bounce apart, stick together or have different masses.
Light gates or motion sensors can measure the velocity of each trolley immediately before and after the collision. Students can then calculate and compare the total momentum on both sides of the event.
Using electronic sensors is particularly helpful because collisions happen quickly and are difficult to measure accurately with a handheld stopwatch.
The kinetic energy of a moving object depends on its mass and the square of its velocity. This means that doubling an object’s speed increases its kinetic energy by a factor of four.
This relationship has major implications for transport and road safety. A vehicle travelling faster requires a much greater distance to stop because considerably more energy must be transferred.
A trolley can be released from different positions on a ramp. Its velocity at the bottom can be measured using a light gate or motion sensor.
Students can calculate the kinetic energy for each release position and compare it with the trolley’s original gravitational potential energy. The investigation can also reveal how much energy is transferred by friction, sound and deformation.
A graph of kinetic energy against velocity squared should show an approximately linear relationship for a constant mass.
Ohm’s Law connects potential difference, current and resistance. It states that:
V = IR
For an ohmic conductor at a constant temperature, current is directly proportional to the potential difference across it.
This equation is fundamental to the design and operation of electrical circuits, from simple classroom components to complex electronic devices.
Students can construct a circuit containing a resistor and variable power supply. The potential difference can be changed gradually while voltage and current are recorded.
Voltage and current sensors allow both quantities to be measured simultaneously. An automated voltage-current graph makes it easier to identify whether the component produces a straight-line relationship.
The investigation can then be repeated using components such as a filament lamp or diode. Their graphs demonstrate that not every electrical component obeys Ohm’s Law under all conditions.
Electrical power describes the rate at which electrical energy is transferred. It can be calculated using:
P = VI
This equation helps explain why different electrical appliances use energy at different rates and why high-power devices require larger currents.
Students can measure the voltage across a component and the current flowing through it. These values can then be used to calculate its electrical power.
Possible investigations include comparing different lamps, motors or resistors, or observing how the power of a component changes as the supply voltage increases.
Simultaneous voltage and current measurements allow power to be calculated throughout the experiment, even when the readings change rapidly.
Boyle’s Law describes the relationship between the pressure and volume of a fixed mass of gas at a constant temperature.
When the volume decreases, the pressure increases. If the temperature remains constant, the product of pressure and volume should remain approximately constant:
pV = constant
This relationship helps explain the operation of syringes, bicycle pumps, breathing and many pneumatic systems.
A sealed syringe can be connected to a gas pressure sensor. The volume of trapped air is changed gradually and the corresponding pressure is recorded.
Plotting pressure against volume produces a curve. Plotting pressure against the reciprocal of volume should produce an approximately straight line.
Measurements should be taken slowly so that the gas has time to return towards room temperature. Compressing it too quickly may temporarily increase its temperature and affect the results.
The speed of a wave is related to its frequency and wavelength:
v = fλ
This equation applies to many kinds of waves, including sound, water waves and electromagnetic radiation.
Frequency tells us how many complete waves pass a point each second, while wavelength is the distance between corresponding points on successive waves.
Students can generate a sound of known frequency and investigate its wavelength using microphones or a suitable sound apparatus. Once the frequency and wavelength are known, the speed of sound can be calculated.
Alternatively, the travel time of a sound pulse can be measured across a known distance. The speed can then be found using distance divided by time.
High-speed data collection is valuable because sound travels quickly and the time intervals involved can be extremely short.
When light travels from one transparent material into another, it normally changes direction. This effect is called refraction and is described by Snell’s Law:
n1sinθ1 = n2sinθ2
The equation connects the angles of incidence and refraction with the refractive indices of the two materials.
Refraction is used in spectacles, cameras, microscopes, telescopes and fibre-optic communication systems.
A narrow ray of light can be directed into a glass or acrylic block at a series of measured angles. Students record the angle of incidence and the resulting angle of refraction.
Rotary motion or angular-position sensing can make it easier to collect consistent measurements. Students can plot sinθ1 against sinθ2 and use the gradient to determine the refractive index.
The inverse-square law explains how the intensity of radiation from a point source changes with distance:
I ∝ 1/r2
If the distance from the source is doubled, the same energy is spread across four times the area, so the measured intensity falls to approximately one quarter.
This relationship can describe light, sound and other forms of radiation under suitable conditions.
A light sensor can be positioned at a series of measured distances from a small light source. The surrounding lighting should be kept constant and background light can be measured separately.
Students can compare light intensity with distance and then plot intensity against 1/r2. If the source behaves approximately like a point source, the second graph should be close to a straight line.
The results also provide an opportunity to discuss why real experiments do not always match an ideal mathematical model perfectly.
Traditional measuring techniques remain an important part of practical science, but data logging can reveal details that are difficult to observe manually.
Depending on the investigation, sensors can:
Most importantly, data logging allows students to spend more time thinking about the science. The sensor collects the measurements, but students must still choose a method, control variables, interpret the graph and decide whether the evidence supports the equation.
Real experimental results are rarely perfect. Friction, heat loss, background light, sensor alignment and measurement uncertainty can all affect the outcome.
This does not necessarily mean that the scientific equation is wrong. Instead, it gives students an opportunity to consider the assumptions behind the model and the limitations of their experimental method.
Useful questions include:
Understanding why results differ from an ideal prediction is an important part of scientific thinking.
Equations can sometimes appear to be finished facts that simply need to be remembered. In reality, they represent patterns discovered through observation, experimentation and measurement.
Newton did not begin with F = ma. Ohm did not simply invent V = IR. These relationships emerged because scientists collected evidence, compared quantities and searched for patterns that could explain what they observed.
Students can follow the same process in the laboratory today. They can apply a force and measure acceleration, stretch a spring, collide two trolleys, compress a gas or watch light bend as it enters a transparent block.
They may be working on a much smaller scale, but the method is the same.
The greatest scientific equations were discovered one observation, one experiment and one measurement at a time. With the right practical equipment and a willingness to investigate, students can discover why those equations work for themselves.
Explore the equations in more detail with our free worksheet. It provides a useful classroom resource for investigating the scientific relationships that help explain forces, motion, energy, electricity, waves and more.
Take a look at the following articles from the same topic.