Published: Sep-2026 | Category: Secondary Science
How long can you keep moving one finger at the same speed? It sounds easy, but repeated movement soon becomes slower, less regular and more difficult to maintain. This simple biology investigation turns that familiar feeling of muscle fatigue into data students can measure and analyse.
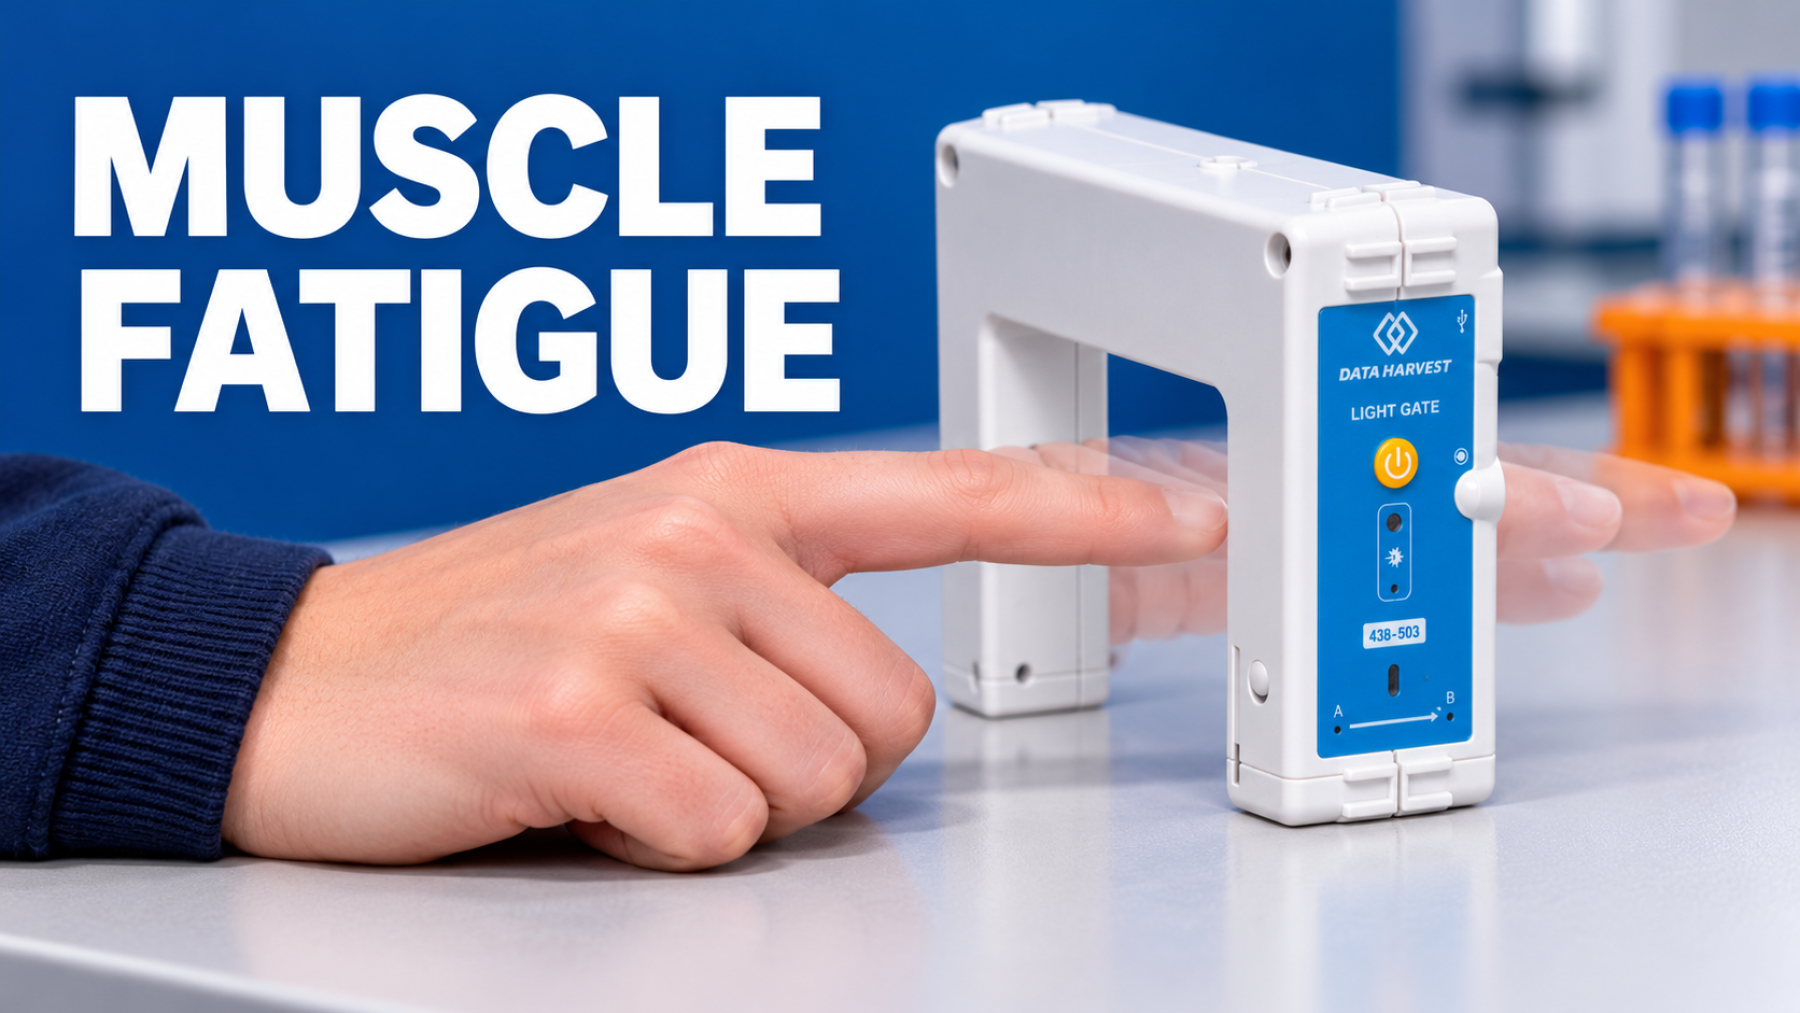
Using a Data Harvest Wireless Light Gate Sensor and EasySense software, students record the speed of repeated finger movements. They can then look for evidence of fatigue and investigate whether warming or cooling the hand changes muscle performance.
Muscles create movement by contracting and pulling on bones across joints. These contractions require energy and depend on processes involving the nervous system, blood supply, oxygen and nutrients.
During repeated activity, a muscle may become less able to maintain the same level of performance. This is called muscle fatigue. It does not have a single cause: changes within the muscle, the availability of energy and the nervous system's control of movement can all contribute.
In this investigation, fatigue may appear as a reduction in finger speed, a longer delay between movements or increasingly irregular movement.
By completing this activity, students can:
Connect the Light Gate in EasySense and select Timing. Choose Speed/velocity at A with a Single interrupt card, then enter the depth of the test subject's finger when prompted.
Position the hand so that the chosen finger can move up and down through the Light Gate's infrared beam. The finger should clear the beam at the bottom of each movement, so the Light Gate does not remain triggered when the finger touches the bench. A book, stand or clamp can be used to adjust the sensor height.
A short practice run is useful. The subject should move only the finger, keeping the hand, wrist and arm still. As fatigue develops, it is tempting to compensate by moving the wrist or arm, which would make the comparison less reliable.
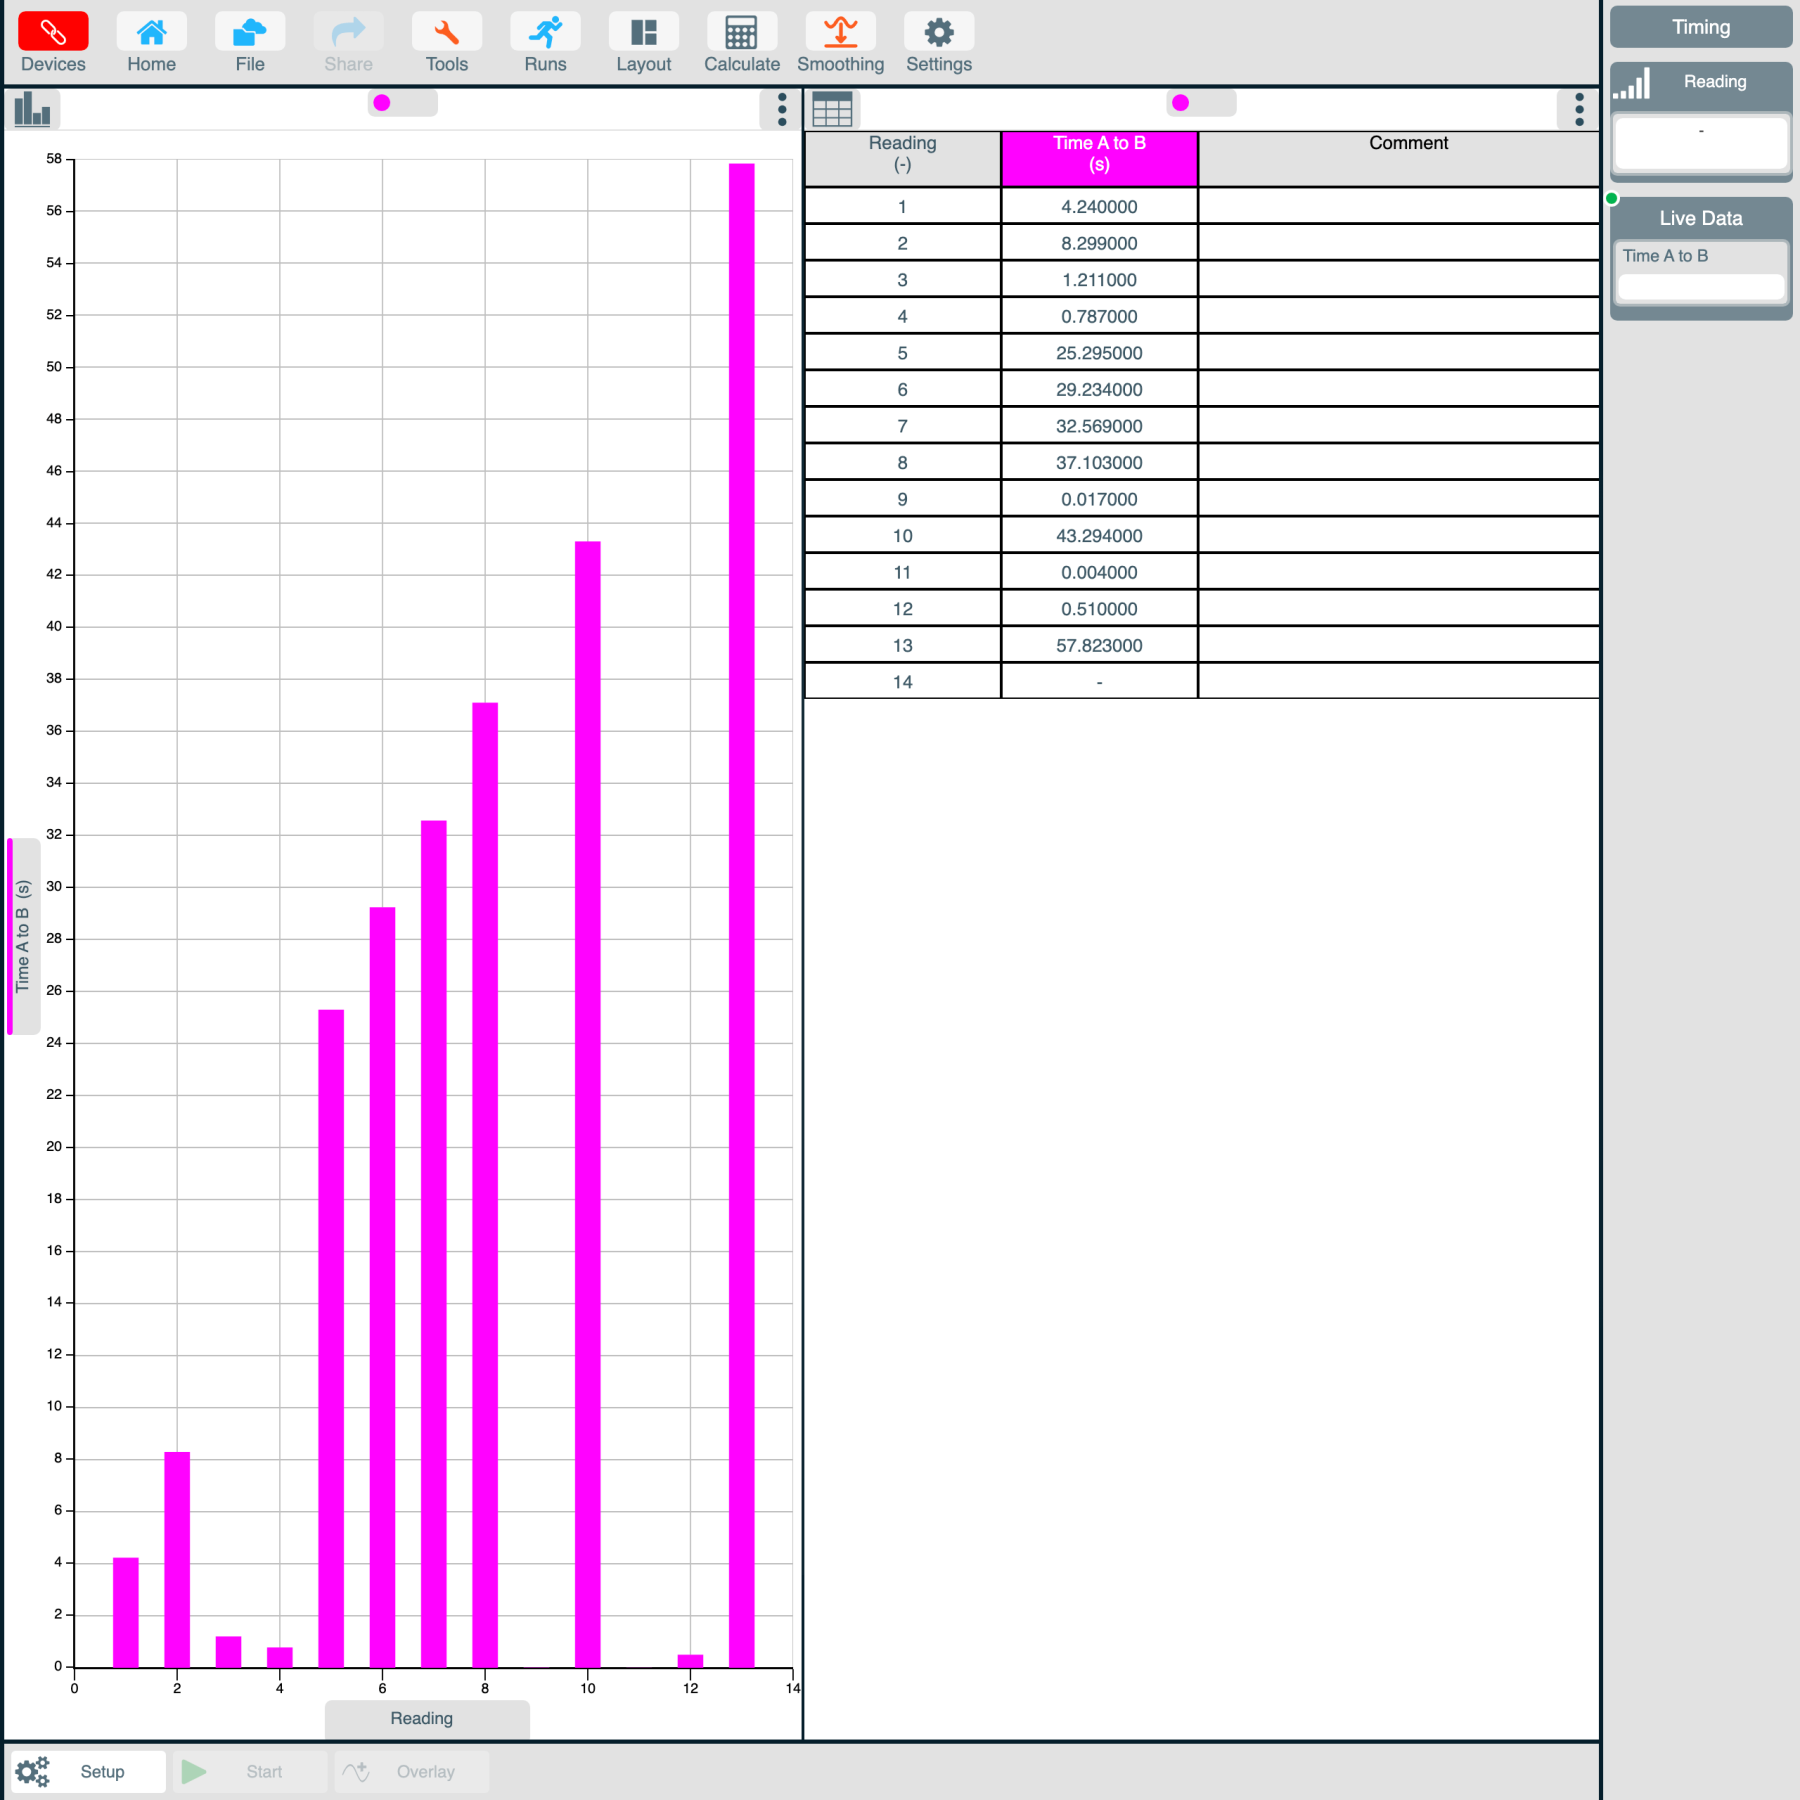
EasySense initially plots speed against reading number. Alternate readings may appear higher and lower because the finger is moving in opposite directions as it enters and leaves the beam. The overall pattern is more important than any one bar.
If the pattern is difficult to see, apply approximately five units of smoothing using the Smoothing tool. A downward trend would show that finger movement is becoming slower as fatigue develops. Smoothing can make the trend clearer, but students should also inspect the original data because smoothing can hide short-term variation.
Speed against reading number does not show the whole story. Change the X-axis to Time to plot speed against time. If the gaps between the bars grow, each repetition is taking longer. This gives students two possible signs of fatigue to consider:
Repeat the investigation after the subject has placed their whole hand in hand-warm water for three to four minutes. Repeat it again after using cool water. Keep the movement, finger position, recording time and rest period as consistent as possible.
Before collecting data, students can form a hypothesis. They might predict that cooling the hand will reduce circulation and affect muscle function, so fatigue will appear sooner. They might also predict that gentle warming will help the muscle maintain its performance for longer. The recorded evidence should decide whether the results support these predictions.
Students can compare the three conditions by asking:
Human investigations naturally contain variation. Motivation, dominant hand, starting speed, finger depth, practice, recovery time and small wrist movements could all affect the result. Students should consider how to control these factors and whether percentage change is more useful than comparing raw speeds between different people.
Students could compare the dominant and non-dominant hand, investigate the effect of a controlled warm-up, or test whether a longer recovery period changes the next trial. Any extension should remain non-invasive, comfortable and designed so that only one variable changes at a time.
This activity makes an everyday biological experience measurable. By comparing speed, timing and the spacing between movements, students can see that muscle fatigue affects more than how a movement feels. It also provides a useful opportunity to discuss hypotheses, variation, fair testing and the difference between a visible trend and a firm conclusion.
The complete Muscle fatigue worksheet includes the apparatus and EasySense setup, step-by-step method, temperature comparison, analysis guidance, questions, example graphs, and teacher and technician notes.
Take a look at the following articles from the same topic.