Published: Aug-2026 | Category: Fun With Science
What happens when light passes through two extremely narrow slits? At first, the answer appears simple. However, the pattern produced by this experiment leads us from waves and interference to single photons, Schrödinger’s equation and the technology we use every day.
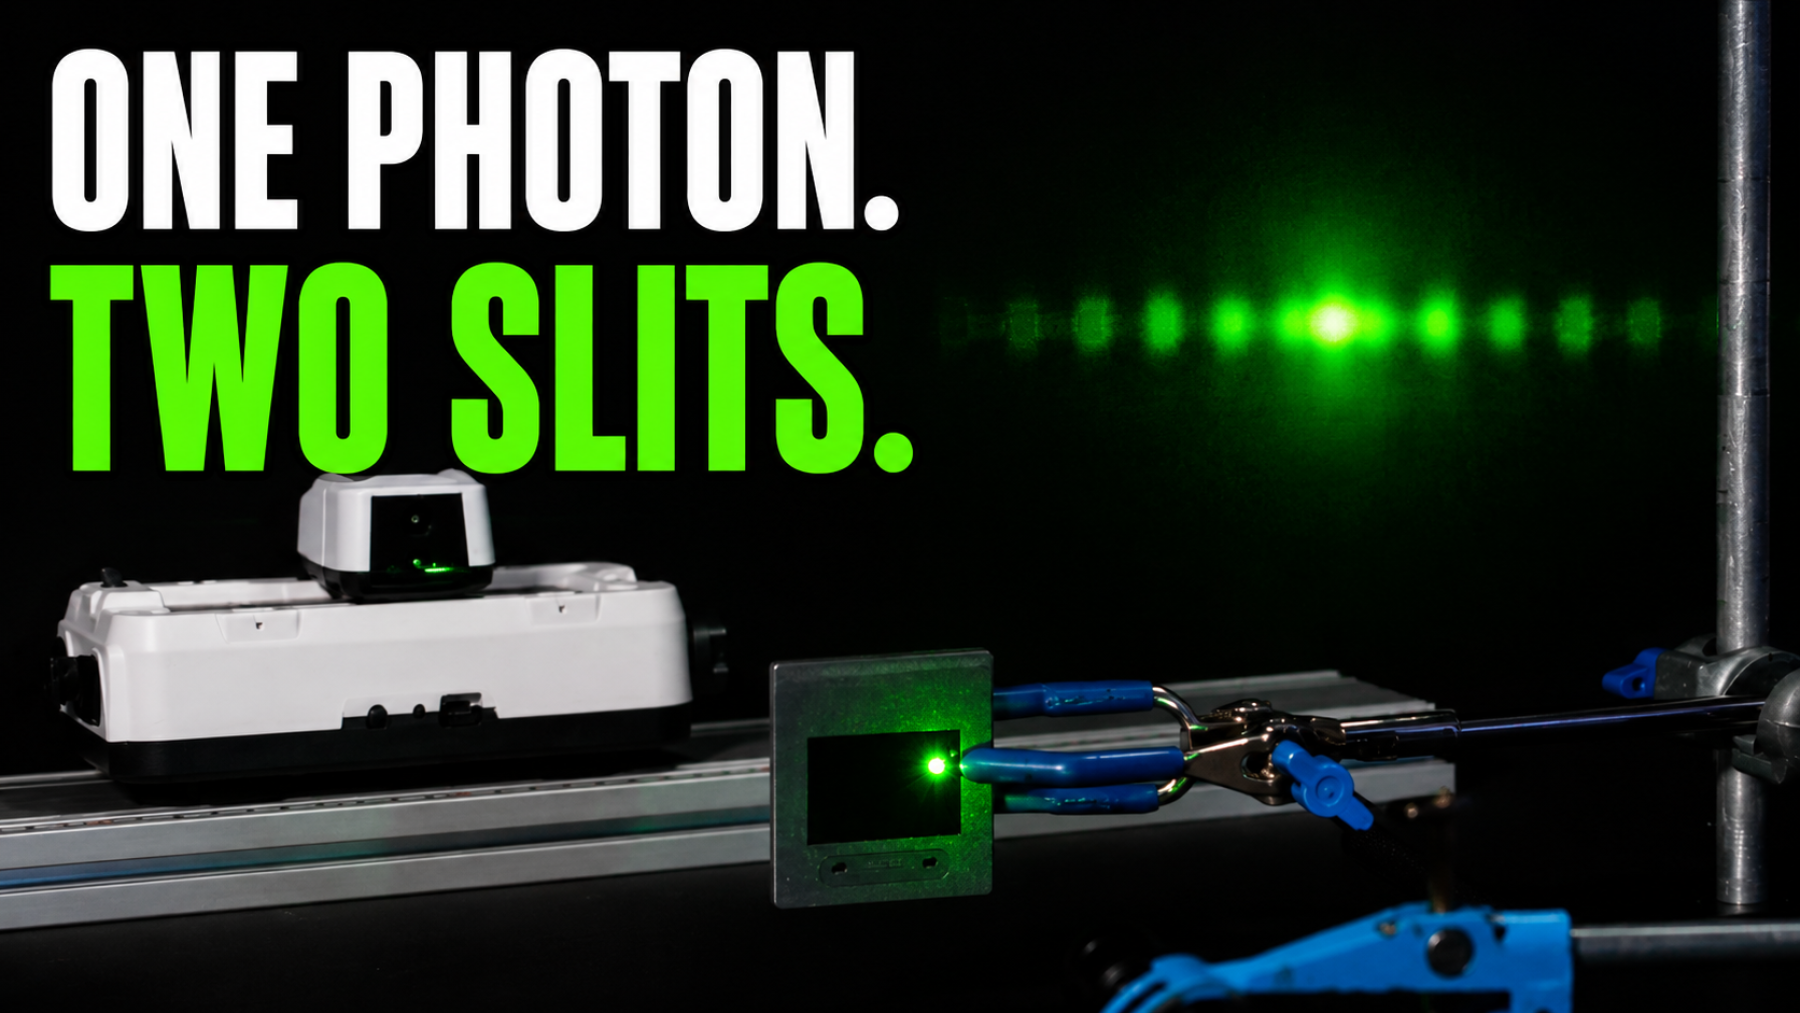
In this investigation, a Light Level Sensor and Dynamics Cart turn the bright and dark bands created by Young’s double-slit experiment into data that can be measured and analysed in EasySense.
When light passes through two closely spaced slits, it spreads out from each opening. The two sets of light waves overlap.
Where the waves reinforce each other, a brighter band appears. Where they cancel, a darker band appears. Together, these alternating bands form an interference pattern.
The classroom experiment uses a continuous laser beam, making the interference pattern easier to observe and measure. It does not detect individual photons, but it provides a useful starting point for exploring the quantum version of the experiment.
The sensor should pass across several fringes on either side of the central maximum. Measuring several fringe gaps and calculating an average is more reliable than measuring only one pair of peaks.
On the EasySense graph, the brighter parts of the interference pattern appear as peaks. The darker areas between them appear as dips or troughs.
The largest peak normally represents the bright central maximum. Further peaks appear on either side as the sensor moves across the pattern.
The graph provides a much clearer way to examine the pattern than relying on sight alone. Students can use the Crosshair or Difference tools to measure the position of several peaks and calculate the average fringe spacing.
The wavelength of the laser light can be estimated using:
λ = sΔx ÷ d
Where:
All measurements must be converted into consistent units before completing the calculation. The result can then be compared with the wavelength stated for the laser.
The experiment becomes even more surprising when it is carried out using equipment capable of releasing and detecting photons one at a time.
Each photon arrives at one particular position and creates one individual detection. At first, these detections appear to be scattered almost at random.
As more photons are detected, the individual dots gradually build into the same type of interference pattern produced by waves.
Quantum physics does not predict the exact position of every individual photon. Instead, it predicts the probability of detecting it in different places. One photon creates one dot, but many detections reveal the overall pattern.
A quantum system can be described using a mathematical object called a wavefunction. The wavefunction does not tell us that a particle is physically spread out like an ordinary water wave. Instead, it helps calculate the probability of different results.
Schrödinger’s equation describes how the wavefunction of a non-relativistic particle, such as an electron, changes over time.
The equation may look complicated, but its basic purpose is straightforward: it helps scientists predict how a quantum system will develop.
Photons require a different, relativistic quantum description. However, the double-slit experiment demonstrates the same central idea: quantum possibilities can combine and influence what we eventually observe.
The double-slit experiment may appear far removed from everyday life, but the same quantum principles help us understand how electrons behave inside materials.
This understanding has made it possible to develop:
A single photon appearing as one tiny dot may seem a long way from the technology inside a smartphone, but both are governed by the same quantum world.
Use a suitable low-power educational laser and follow your school or college laser safety procedures.
Find the Young’s double-slit diffraction and Schrödinger’s equation activity in Practical Explorer, together with teacher guidance, apparatus information and further Data Harvest investigations.
Young’s double-slit experiment begins with a simple pattern of bright and dark light. Measuring that pattern reveals the wavelength of the laser, while the single-photon version leads to much deeper questions about probability and the quantum world.
By observing the pattern, collecting accurate data and asking what it means, students can follow the same journey that has taken physics from a nineteenth-century experiment to modern quantum technology.
Take a look at the following articles from the same topic.