Published: Jul-2026 | Category: Fun With Science
How fast can you score a goal using just one flick of your finger?
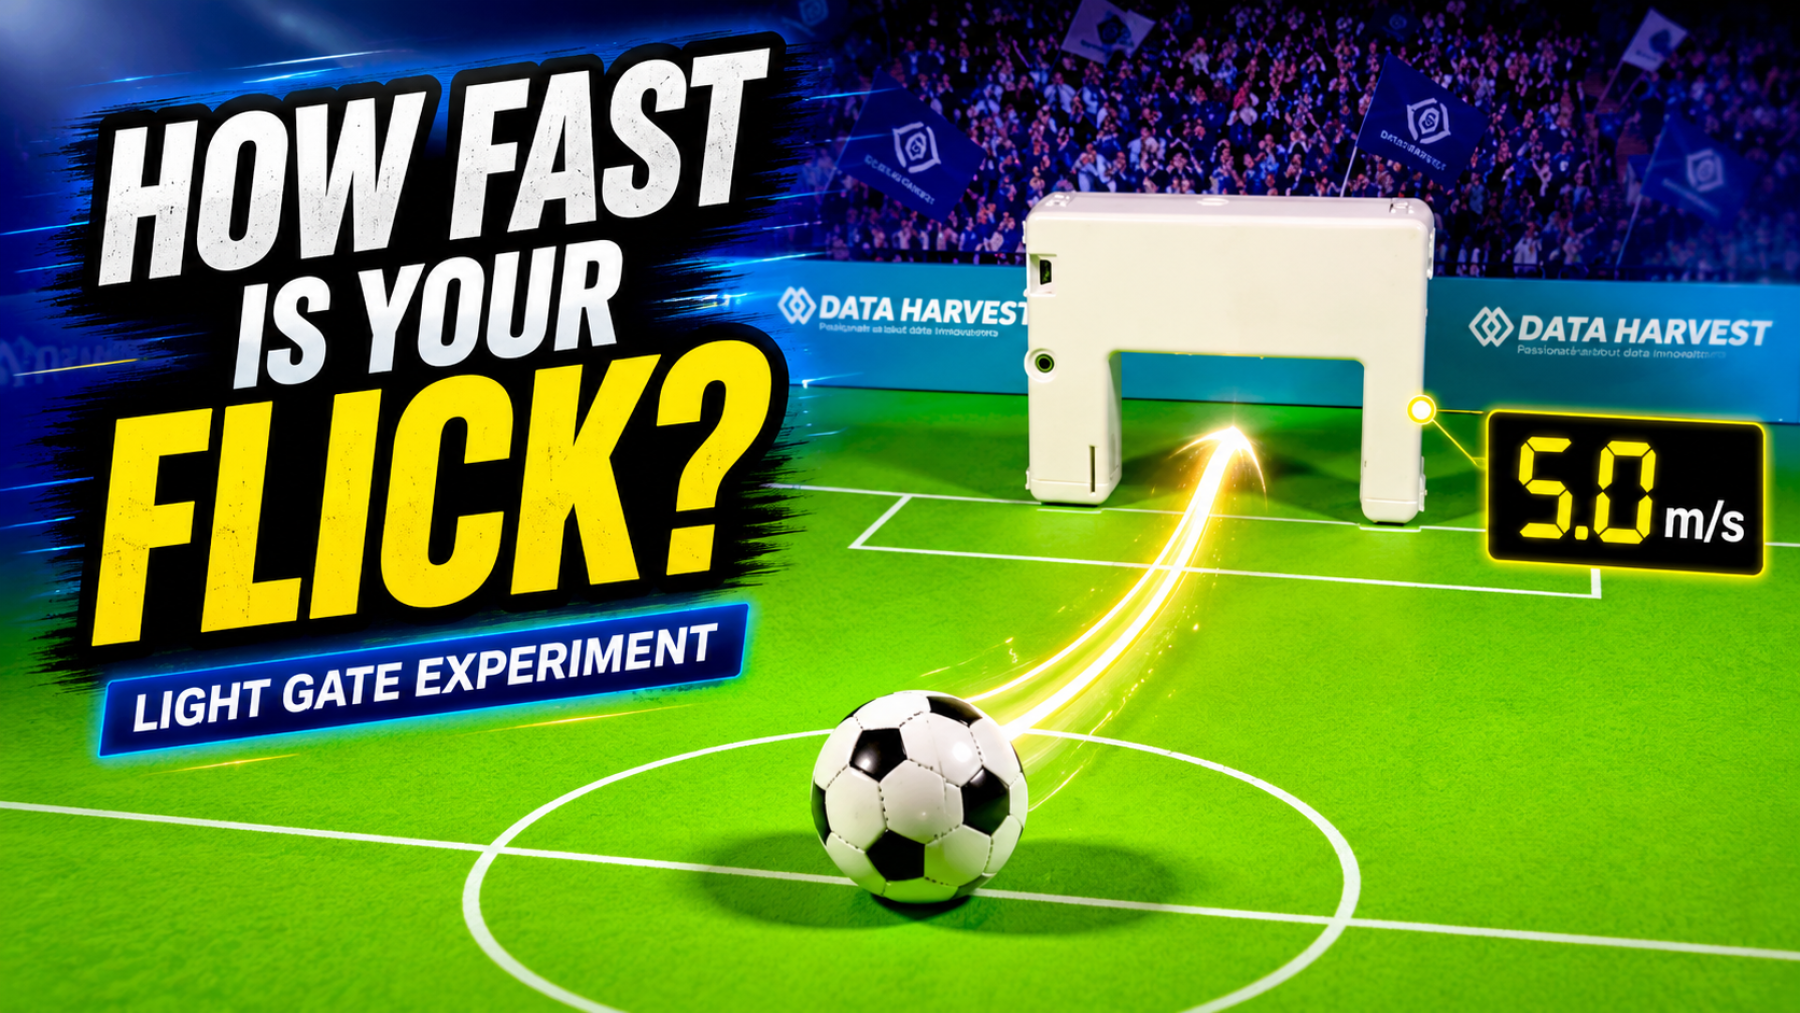
In this practical physics investigation, students turn a game of flick football into a scientific experiment. Using a miniature football pitch and a Data Harvest Wireless Light Gate as the goal, they measure the speed of a small football and investigate how the strength of a flick affects its motion.
It is a fun and accessible way to explore force, acceleration, speed, friction, experimental control and data analysis while connecting classroom physics to football and sports science.
Applied Flicksics combines flick football with the physics of motion. Instead of simply trying to score a goal, students use scientific equipment to measure how fast the ball is travelling.
The Light Gate is positioned at one end of the miniature pitch and acts as the goal. When the ball passes through the sensor beam, the software measures how long the ball interrupts the beam. Once the diameter of the ball has been entered, EasySense can use this timing information to calculate its velocity in metres per second.
Students compare soft, medium and hard flicks, repeat their measurements and calculate a mean speed for each type of shot.
The scientific study of motion has developed over many centuries. Galileo Galilei demonstrated that movement could be measured and investigated through careful observation and experimentation. Sir Isaac Newton later described how forces affect the motion of objects through his laws of motion.
The same principles can be seen every time a football is kicked, passed or rolled. A force acting on the ball causes it to accelerate. Once the ball has left the player’s foot, other forces and forms of resistance begin to affect its motion.
In this tabletop version, the student’s finger provides the force. A stronger flick will usually cause greater acceleration while the finger is in contact with the ball, resulting in a higher starting speed.
The quality of a football pitch has an important effect on how a ball moves. A soft, rough, muddy or uneven surface can increase resistance, slow the ball more quickly or make its path less predictable. A firm and even surface usually produces a more consistent roll.
Modern natural, hybrid and artificial football pitches are carefully constructed and maintained. Their performance can be assessed by measuring characteristics such as surface evenness, hardness, stability, ball bounce and ball roll.
The same idea applies to the miniature pitch used in this experiment. The surface affects the resistance acting on the ball, so it should be kept the same throughout the investigation. The starting position and distance between the ball and the Light Gate must also remain unchanged.
By controlling these variables, students can be more confident that differences in the recorded speed are mainly caused by the strength of the flick.
This investigation turns an everyday game into a measurable scientific experiment. Students can see the ball move, collect an accurate speed reading and compare their observations with real numerical data.
It demonstrates why sensors are valuable in practical science. Judging whether one flick looks faster than another is subjective, but a Light Gate provides an accurate measurement that can be recorded, repeated and analysed.
The activity also introduces several important scientific ideas:
This investigation allows students to:
The ball should interrupt the Light Gate beam across its full diameter. An inaccurate diameter measurement or a ball passing through the edge of the beam may affect the calculated result.
Place the ball on the starting position and flick it towards the Light Gate goal. Begin with a soft flick, followed by a medium flick and then a hard flick.
Record the speed produced by each shot. Repeat each type of flick at least three times and calculate the mean speed.
Students should also record observations about the movement of the ball, including whether it:
The independent variable is the strength of the flick. The dependent variable is the speed recorded by the Light Gate.
Control variables should include:
A typical set of results may show a clear increase in speed as the strength of the flick increases:
| Flick type | Trial 1 | Trial 2 | Trial 3 | Mean speed |
|---|---|---|---|---|
| Soft | 2.9 m/s | 3.2 m/s | 3.1 m/s | 3.06 m/s |
| Medium | 4.8 m/s | 5.1 m/s | 4.9 m/s | 4.93 m/s |
| Hard | 7.1 m/s | 7.3 m/s | 6.7 m/s | 7.03 m/s |
The precise values will vary between students, but the overall pattern should usually be:
Stronger flick → greater acceleration → higher ball speed.
Repeated flicks will not produce identical results because it is difficult for a person to apply exactly the same force and direction every time. Small changes in finger position, contact time, spin and launch angle can all affect the reading.
When a student flicks the ball, their finger exerts a force over a short period of time. This force causes the ball to accelerate from rest.
A harder flick usually applies a greater force, so the ball leaves the finger at a higher speed. Once contact with the finger ends, the ball continues moving because of its inertia.
However, it does not continue at the same speed indefinitely. Friction, rolling resistance and air resistance act against its motion and gradually reduce its speed.
The distance between the starting point and the Light Gate is therefore important. If the ball travels further before reaching the sensor, resistance has more time to slow it down. This distance must remain constant during a fair comparison.
Some of the energy supplied by the flick may produce rotation rather than forward motion. A ball with a large amount of spin may therefore behave differently from one travelling mainly in a straight line.
Spin can also make the ball curve, change direction or pass through a different part of the Light Gate. Recording these observations can help students explain unusual or inconsistent results.
Using a Data Harvest Light Gate with EasySense gives students an immediate numerical result after each shot. Instead of estimating the speed by eye, they can collect accurate timing data and compare repeated trials.
This supports practical data-handling skills, including:
The result is an engaging experiment that combines play, measurement and scientific reasoning.
Once students have completed the main investigation, they can attempt the penalty shootout challenge.
The target is to flick the ball through the Light Gate at:
5.0 ± 0.2 m/s
Can students achieve a speed between 4.8 and 5.2 m/s three times in a row?
This changes the task from producing the fastest possible flick to controlling the applied force. It also provides an effective way to discuss accuracy, precision, repeatability and technique.
The movement of a real football depends on many interacting factors, including the force applied by the player, the angle of contact, the spin of the ball, air resistance and the condition of the playing surface.
In sports science, speed measurements can be used to analyse shooting, passing and ball-control techniques. Coaches and athletes can compare results, identify changes in performance and assess how different techniques affect the movement of the ball.
Pitch designers and grounds teams also consider how the surface interacts with both players and the ball. Professional playing surfaces are assessed for consistency, stability, evenness and ball roll so that the game remains predictable and safe.
The tabletop experiment provides a simplified model of these real-world investigations and shows how accurate sensors can reveal differences that may be difficult to judge by observation alone.
Once students have completed the basic investigation, they can extend it in several ways:
A particularly useful extension is to repeat the investigation using different playing surfaces.
Students could compare a smooth card pitch with fabric, foam or short artificial grass. The same ball, starting position and flicking method should be used for each surface.
They can then investigate questions such as:
This extension provides a clear introduction to friction, rolling resistance and the importance of pitch quality in real football.
The Applied Flicksics investigation is available as a free downloadable worksheet, including the method, results table, analysis questions, teacher guidance and extension activities.
Download the Applied Flicksics worksheet
You can also search for more practical science investigations by sensor, topic or discipline using Data Harvest’s Practical Explorer.
Explore free experiments in Practical Explorer
The Data Harvest Wireless Light Gate Sensor is designed for investigating motion in the classroom. It can be connected using Bluetooth or USB and used with EasySense to convert precise timing measurements into quantities such as speed and acceleration.
As well as Applied Flicksics, the Light Gate can be used for investigations involving dynamics carts, free fall, pendulums, acceleration, Newton’s laws, collisions and kinetic energy.
Learn more about the Wireless Light Gate Sensor
Applied Flicksics is a memorable way to introduce force, motion and speed through the familiar game of flick football. Students apply different strengths of flick, measure the resulting velocity with a Light Gate and use repeated data to identify a clear pattern.
The miniature football pitch also provides an opportunity to explore how surface quality, friction and rolling resistance affect motion. By controlling the surface, ball, starting position and distance to the goal, students develop a stronger understanding of fair testing and reliable measurement.
It is a practical investigation that brings together physics, sport and data analysis while challenging students to discover not only who can produce the fastest flick, but who can explain the science behind it.
Take a look at the following articles from the same topic.